Working with tiles
Note
This feature requires the CRM Suite Core plan.
Learn how to add, customize, and manage tiles in your SuperOffice dashboards. Tiles are visual summaries based on CRM data—ideal for tracking requests, sales, activities, or marketing results.
You can use pre-defined tiles or create your own.
Prerequisite: switch to layout mode
To manage tiles, you must first enter layout mode:
Open the dashboard you wish to customize.
In the dashboard header, click and select Edit dashboard tiles.
The dashboard enters layout mode:
- The Edit dashboard tiles sidebar opens on the right.
- Each tile shows an edit icon ().
- You can add, move, resize, or edit tiles.
Add tile
In the Edit dashboard tiles sidebar, choose the type of data (such as company, sale, or request) from the Show tiles for list.
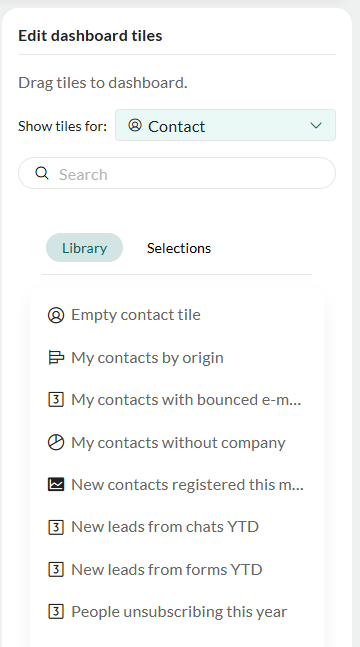
Choose a tile from either the Library (pre-defined tiles) or Selections (tiles based on your own dynamic selections).
- Use the search field to quickly locate tiles.
- Each tile has an icon indicating its type—such as chart, list, or big number.
Add the tile to the dashboard:
- Drag and drop the tile into an available slot.
- Or, click the icon that appears when hovering the tile name.
The tile will automatically adjust to the available space and align with the dashboard layout.
Resize or reposition tiles as needed.
Click Done to exit layout mode.
Create a tile from scratch
Select the Empty tile option for the type of data you want to visualize.
Add it to the dashboard.
In the Edit tile dialog, enter a descriptive name.
Select the Dataset tab and define the criteria to control what data the tile will display.
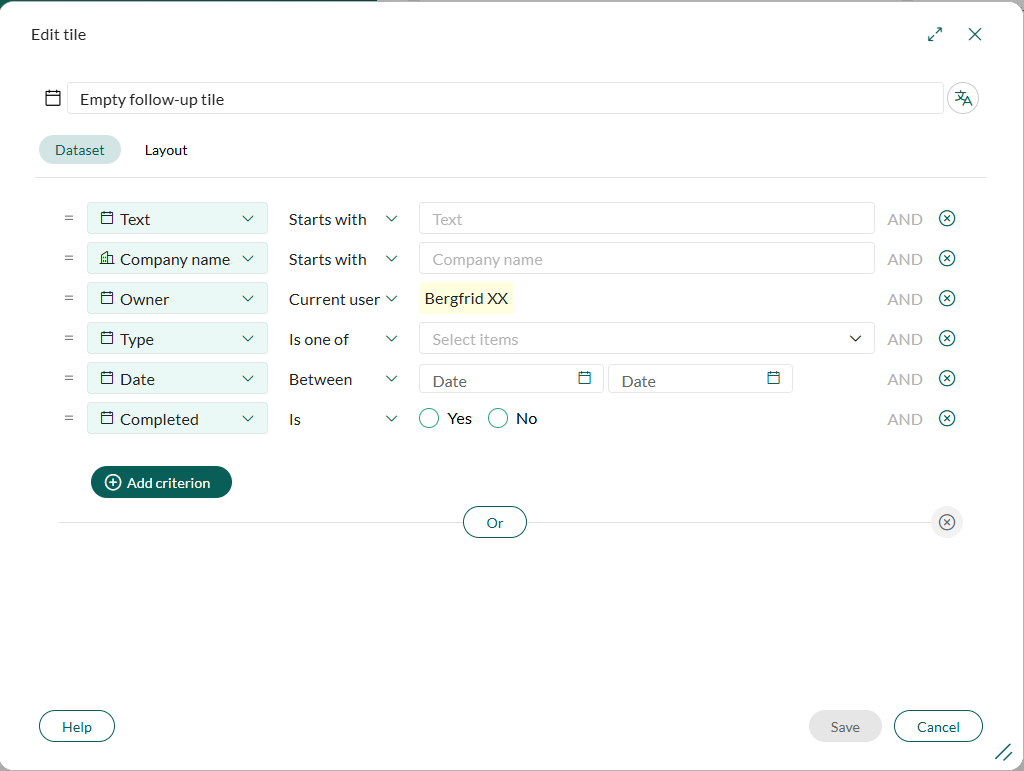
This tab works like the Find screen. Use it to define filters such as owner, date range, or category.
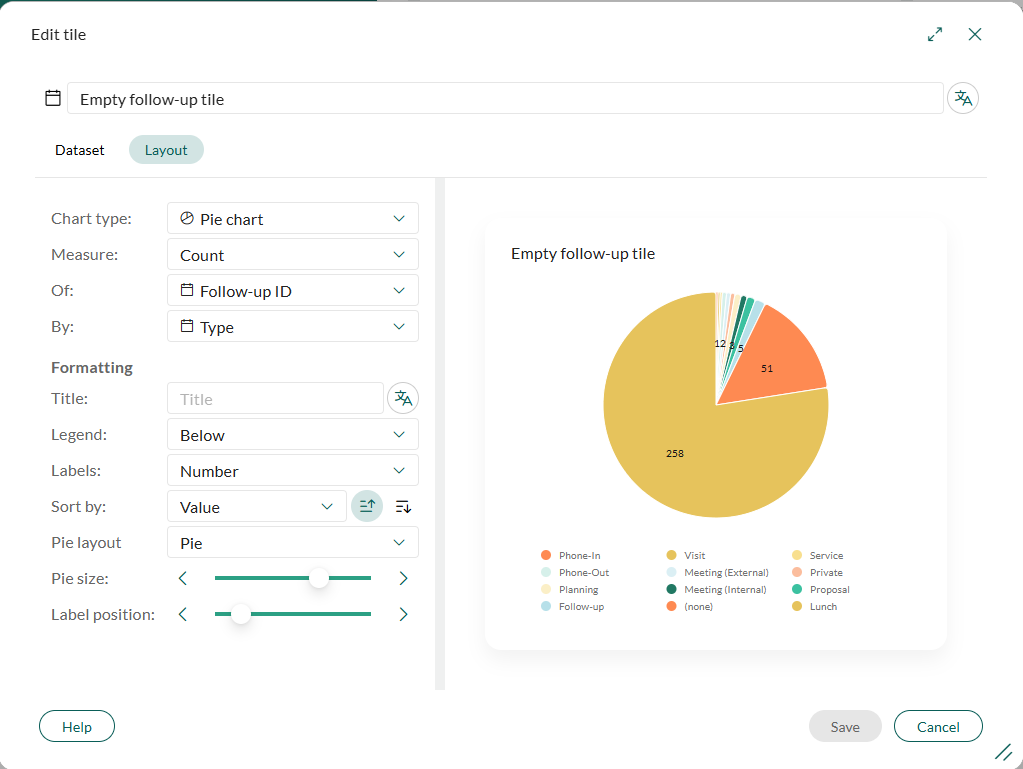
Go to the Layout tab to configure the tile's appearance. Choose chart type, labels, sorting, and other formatting options.
Click Save, then click Done to exit layout mode.
About selection-based tiles
When you add a tile from the Selections tab, you are not linking the tile to a live selection. Instead, you are copying the current dataset and layout from the chart defined in the selection. After that point, the tile and the selection are independent.
The Selections tab only shows:
- Dynamic selections
- Selections matching the type chosen in Show tiles for
- Selections with a saved chart on the Chart tab
If a selection is missing from the list, check:
- Is it a static selection? Static selections are not supported here.
- Does the record type (company, sale, and so on) match the selected type?
- Has a chart been defined and saved on the Chart tab?
After you add the tile:
- Changes to the criteria or chart in the selection do not affect the tile.
- Changes to the dataset or layout in the tile do not affect the selection.
- The tile does not stay in sync with the selection, but it still updates dynamically based on its own dataset.
If you want the tile to reflect updates from a selection, either adjust the tile manually or delete and re-add it from the updated selection.
Add a web panel tile
Use this tile to embed a webpage inside the dashboard:
- Set Show tiles for to Other.
- In the Library tab, select Web panel.
- Enter the URL you want to display.
- If the URL uses HTTP (not HTTPS), enable Allow insecure address.
- Click Save, then click Done to exit layout mode.
Add an HTML tile
Use this tile to display formatted text in your dashboard. For example, a welcome message, legend, or internal explanation.
Set Show tiles for to Other.
In the Library tab, select HTML.
Click Add to select at least one language for the content.
Use the built-in editor to enter and format your content.
You can use the same formatting options available in Chat and Forms. Add content in multiple languages to ensure the tile displays correctly for all users.
Click Save, then click Done to exit layout mode.
Edit a tile
- While in layout mode, click the Edit icon () on the tile.
- In the Dataset tab, adjust the filters as needed.
- In the Layout tab, select the chart type and visual settings.
- Update the tile name to match the updated data or layout.
- Click to add a translation to the tile title and labels.
- Click Save.
Note
CRM Suite: Editing tile layout (chart type, labels, and other visual settings on the Layout tab) requires the Growth plan or higher. On Starter or Core plans, the Layout tab fields are read-only and a message at the bottom of the dialog explains the restriction. Administrators can click Upgrade to open a contact form.
Duplicate or copy a tile
You can reuse an existing tile by either duplicating it in the same dashboard or copying it to another dashboard. You must have edit access to the target dashboard to copy a tile to it.
- Click on the tile and select the duplicate or copy option.
| Option | What it does | What to do next | Use case |
|---|---|---|---|
| Duplicate tile | Creates a copy of the tile in the current dashboard. The name is updated (for example, Tile name 2). | Typically, you edit the duplicated tile: change the name, update the dataset or layout. | Show the same type of data with a different layout, or show similar data using the same layout. |
| Copy tile to dashboard | Adds the tile to another dashboard. Choose a target dashboard from the list. Hover over a dashboard name to preview its current tiles before copying. | Optionally open the target dashboard. Edit the tile there if needed. | Reuse a useful tile you found in a coworker's dashboard. Add it to one of your own dashboards. |
Copy to dashboard is also available outside layout mode (normal dashboard view).
Rearrange or resize tiles
While in layout mode:
- Drag a tile by its header to move it to a new position.
- Resize a tile by dragging its bottom or right edge, or the lower-right corner.
Tiles automatically snap to the dashboard's grid layout.
To change the number of columns, exit layout mode and update the dashboard details.
Remove a tile
You can remove tiles from a dashboard, as long as you have editing access.
- While in layout mode, click on the tile.
- Select Remove tile.
- Confirm the deletion.
Caution
Custom tiles, such as HTML, web panel, and selection-based tiles, are permanently deleted when removed. Only pre-defined tiles from the Library can be safely re-added later.
Export tiles
Download or print the tile report
Click in the header of a tile to access the following options:
Download PDF document / Download PNG document: Download the tile in PDF or PNG format. The export files are downloaded to your browser (Downloads folder).
For other formats (SVG, CSV, and XLS), choose View in full screen from the menu.
Print: Open the tile in the print dialog.
Tip
To hide specific data before exporting or printing a tile, click the data labels (legend) next to or under the tile to hide data.
Export ALL rows in a dataset to Excel
Click a data point in the tile to drill down into the data.
A new window opens with the related records.
Click Export below the list.
Click Yes to confirm.
This operation may take a while. You can continue working in SuperOffice while waiting. You will be notified when the export is complete.
Tips
Hide currency labels: To save space on tiles that show amounts, set Currency to Hide in the Layout tab.
Compare to target: For sales dashboards, enable Compare to target in the Layout tab to visualize progress toward sales goals. This option depends on the chart type and dataset setup.
Use short numbers for better readability: For tiles with large values, enable Short number format to display values in millions (for example, 1.2M).
Big number tiles: Use these for key metrics, like revenue or open requests. Keep the tile name short so the number stands out clearly.
Show duration on follow-up tiles: When using follow-up tiles, set Measure to Duration to track time spent more effectively.
Troubleshooting
I do not see the edit icon on the tile
- Is the dashboard in layout mode?
I do not find the option I am looking for in the Task menu
- Did you click the correct Task button? (dashboard vs. tile)
- Is the dashboard in layout mode?
I cannot access the layout tab or fields
- You may not have the required functional rights. Contact your administrator.
- CRM Suite: On Starter or Core plans, the Layout tab fields are read-only. Editing tile layout requires the Growth plan or higher.
I cannot create or duplicate a dashboard
- CRM Suite (Starter plan): The Starter plan includes up to 3 dashboards. When this limit is reached, Create dashboard and Duplicate dashboard are unavailable. Delete an existing dashboard or upgrade to the Core plan or higher. See Plan limits.
A selection is missing from the Selections tab
I accidentally removed a custom tile
- These tiles cannot be restored. To avoid this, copy them to a private dashboard (for example, "Archived tiles") before deletion.