Dashboards
Dashboards in SuperOffice CRM give you instant visual insight into your work, your team's progress, and key company metrics. They display key numbers and trends using tiles linked to typical searches or other data sources.
Use dashboards to track activities, sales, requests, and more. You can view pre-defined dashboards or create your own.
Note
Your access to dashboards and tile data depends on your plan and assigned rights.
What is a dashboard?
A dashboard is a customizable view of your CRM data. It displays one or more tiles—mini visual reports that show summaries, counts, or charts based on your data. Dashboards help you stay informed and make decisions faster.
Each tile contains a graphical or numerical representation of SuperOffice data. It is the data behind the tiles that makes a dashboard useful.
Terminology
- Dashboard: A screen that displays CRM data visually using one or more tiles.
- Tile: A configurable panel in a dashboard. Tiles can show charts, lists, or numbers.
- Chart: A graphical representation of tile data, such as a pie chart or bar chart.
- Dataset: The underlying data source for a tile, typically based on criteria.
Access your dashboards
Select Dashboard in the navigator to open the dashboard screen. You can access:
- Pinned dashboards: Distributed to you by an administrator
- Favorite dashboards: Marked with a star icon
- Own dashboards: Dashboards you created yourself
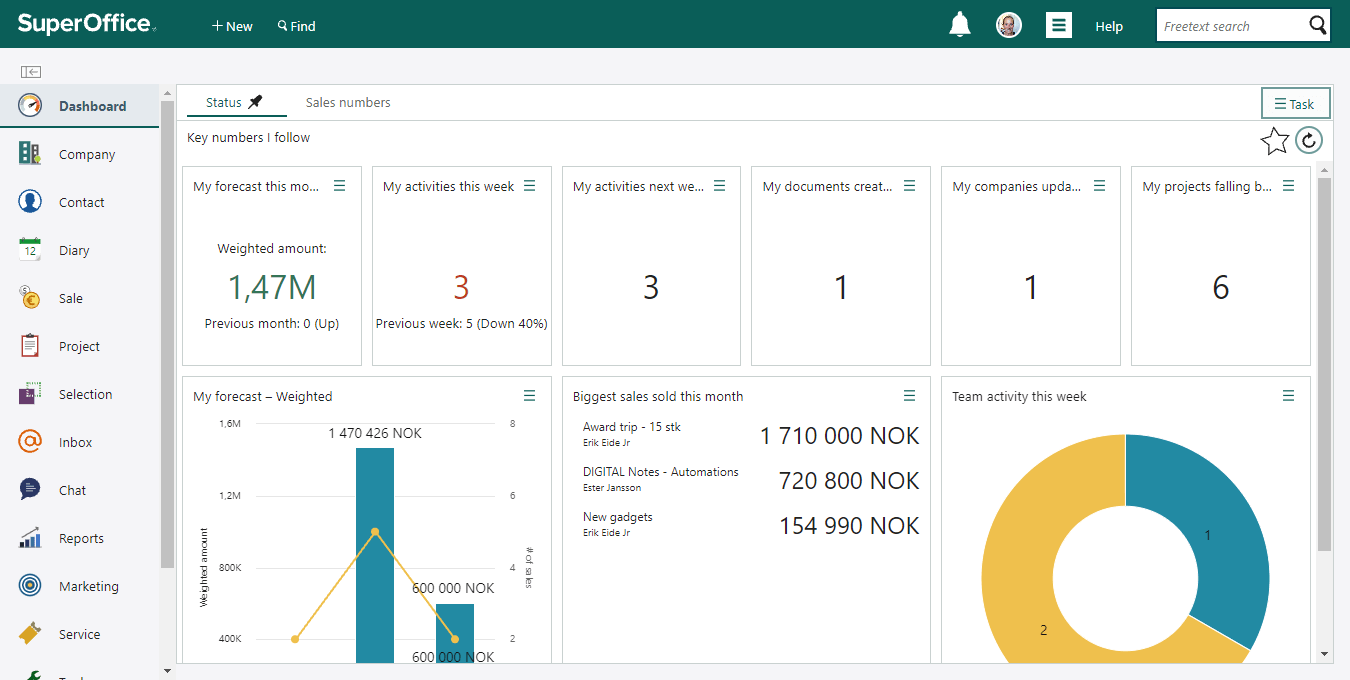
By default, a dashboard called Status is available and pinned. It contains tiles with pre-defined charts and key numbers. If you have a Service Essentials license or the Starter plan, a second dashboard called Requests is also available.
You can create additional dashboards or duplicate existing ones to customize them.
Pinned and favorite dashboards are displayed across the top of the screen, along with the most recently used dashboard. Use the search field in the navigator to find other dashboards available to you.
| Icon | Description |
|---|---|
| Pinned dashboard. | |
| Favorite dashboard. Click to toggle. | |
| Refresh all tile data. | |
| Task menu for dashboard actions. |
Tiles
Tiles are the building blocks of a dashboard. Tile data typically relates to you, or your groups, and to a specific period (such as this month, last 6 months).
A tile can show:
- A chart, such as a bar or pie chart. Charts are graphical visualizations of data, sometimes called a graph.
- A list of up to 100 records from a selection.
- A big number, such as total sales. Highlights a key performance indicator (KPI).
- A web panel that loads a URL.
- HTML content, formatted directly in the tile.
You can add pre-defined tiles or create your own.
Chart types
The chart type determines how data is displayed inside the tile.
| Icon | Type | Description |
|---|---|---|
| Pie chart | A circular-shaped graph. | |
| Funnel | Visualizes the lead qualification process. | |
| Big number | A number in big letters with options to compare to value or period. | |
| List | A list overview with max 100 items. | |
| Column chart | A column chart plots the variable value vertically. | |
| Bar chart | A bar chart plots the variable value horizontally. | |
| Line chart | A series of data points with a continuous line. | |
| Area chart | A graph that combines a line chart and a bar chart. | |
| Gauge chart | Also known as dial charts or speedometer charts, use needles to show information as a reading on a dial. | |
| Column + line (2 axes) | A dual axis chart that combines a column and line chart. | |
| Bar + line (2 axes) | A dual axis chart that combines a bar and line chart. |
View and interact with tiles
Each tile shows a snapshot of real-time data from its source. You can interact with tiles to explore the underlying data.
Hover over chart areas to view tooltips with more detail.
Click a value in the chart legend to show or hide data series. This is useful when printing or exporting tiles.
To expand a tile, click and select View in full screen.
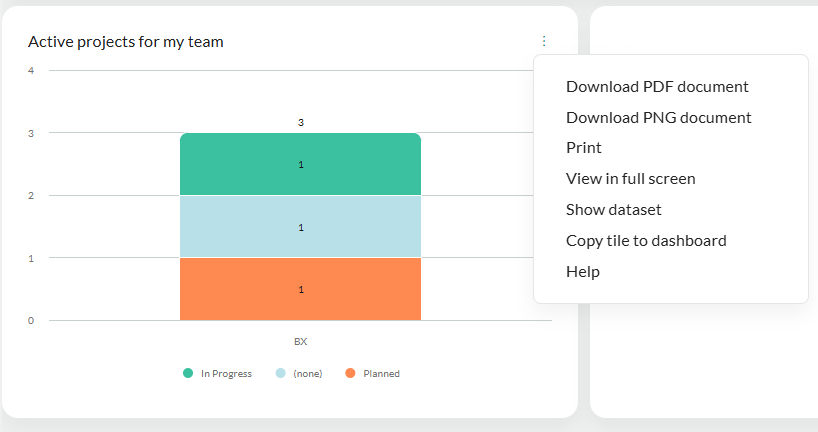
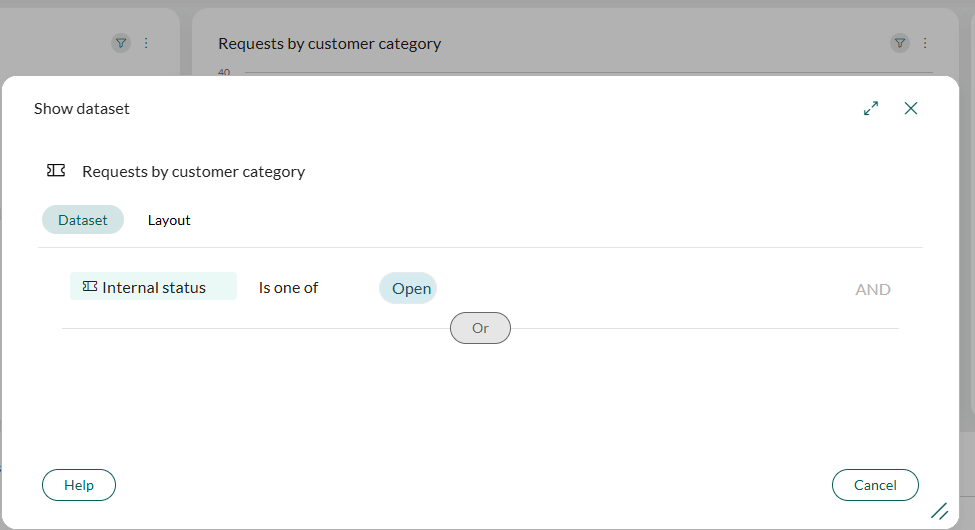
To view the dataset, click and select Show dataset. This displays the criteria that determines what data the tile shows.
Use quick filters to narrow down the data shown on the dashboard.
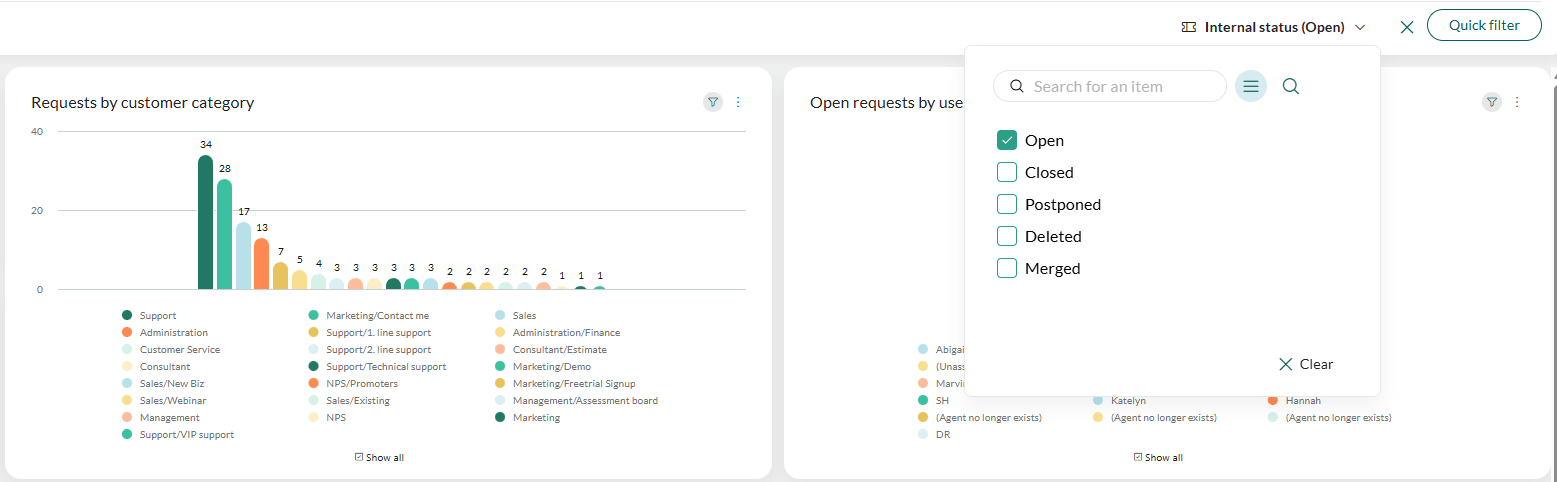
- Select one or more values to instantly filter all tiles on the dashboard.
- Tiles affected by a filter show a funnel icon .
- Click X on a filter to clear that filter, or click X on the filter bar to clear all filters.
Drill down into data by clicking a data point (for example, a bar or pie segment). A new window opens with the related records. In the drill-down view:
- Select a record to preview it.
- Double-click a record to open it, or select a record and click Open.
- Click and select Copy into selection to copy one or more records for follow-up. If no records are selected, the entire result set is copied.
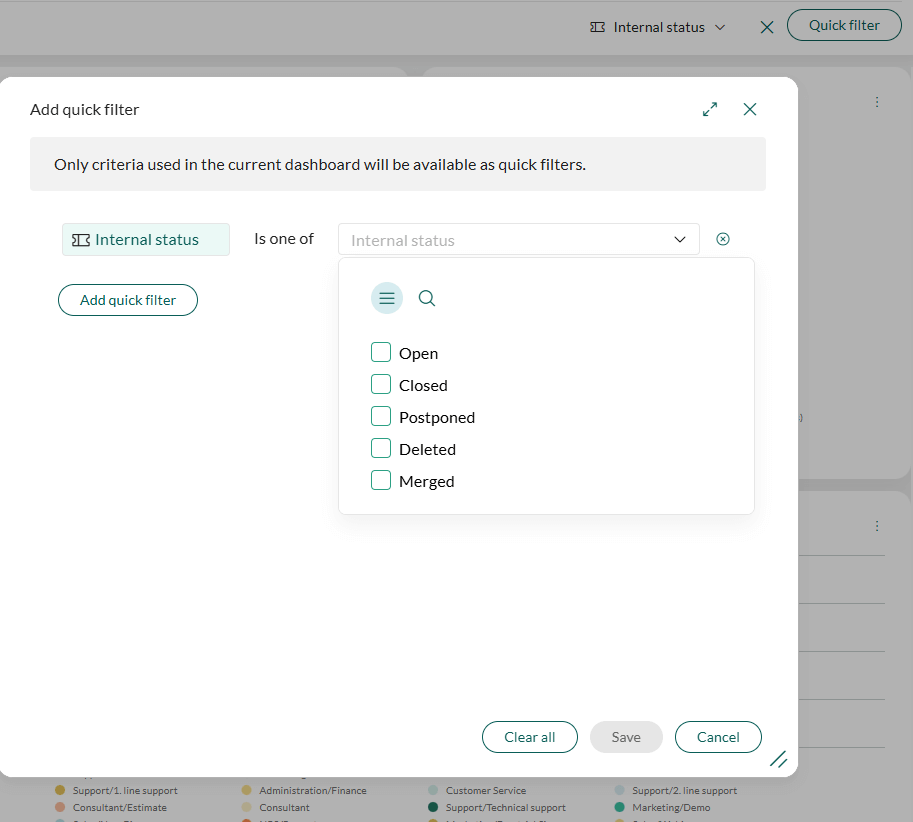
Configure quick filters (admin/owner)
All users who can view the dashboard can use the filters, but only the owner and administrators can add, change, or remove them.
To configure quick filters:
Click Quick filter in the dashboard header.
Click Add quick filter and choose a criterion from the list.
- Only criteria that are already used in one or more tiles on the current dashboard can be added as quick filters.
- To see which criteria a tile uses, click and select Show dataset.
Optionally, restrict the selectable values (for example, limit Internal status to only Open and Closed).
Repeat steps 2-3 to add more filters.
Click OK to save the filter set.
Requirements
Dashboard features depend on your assigned functional rights and license level. All users can:
- View dashboards pinned or shared with them
- Create, customize, and delete their own dashboards
Note
Tiles display only data you have access to.
If you cannot edit or pin a dashboard, contact your administrator to check your functional rights.
Functional rights
Functional rights are assigned to user roles in Settings and maintenance. These rights control who can share and manage dashboards.
- Dashboard administrator:
- Pin dashboards to users or groups
- General administrator:
- Update dashboards created by others
- Cannot delete dashboards they do not own
Only the owner of a dashboard can delete it.
License-specific dashboard features
| License | Dashboards included | Tile types |
|---|---|---|
| All CRM plans | Status dashboard with standard tiles | Charts, lists, big numbers |
| Service | Requests dashboard | Request-related tiles |
| Marketing Essentials license or the Core plan | – | Mailings, chats |
| Marketing Premium license or the Plus plan | – | Form submissions |
| Sales Premium or Growth | – | Product-level forecasts, KPIs, sales targets, quotes |
| Sales or Service Premium or Growth | – | Activity monitors (SAINT) |
Tips
- Use favorites to quickly access your most-used dashboards.