Use board view in selections
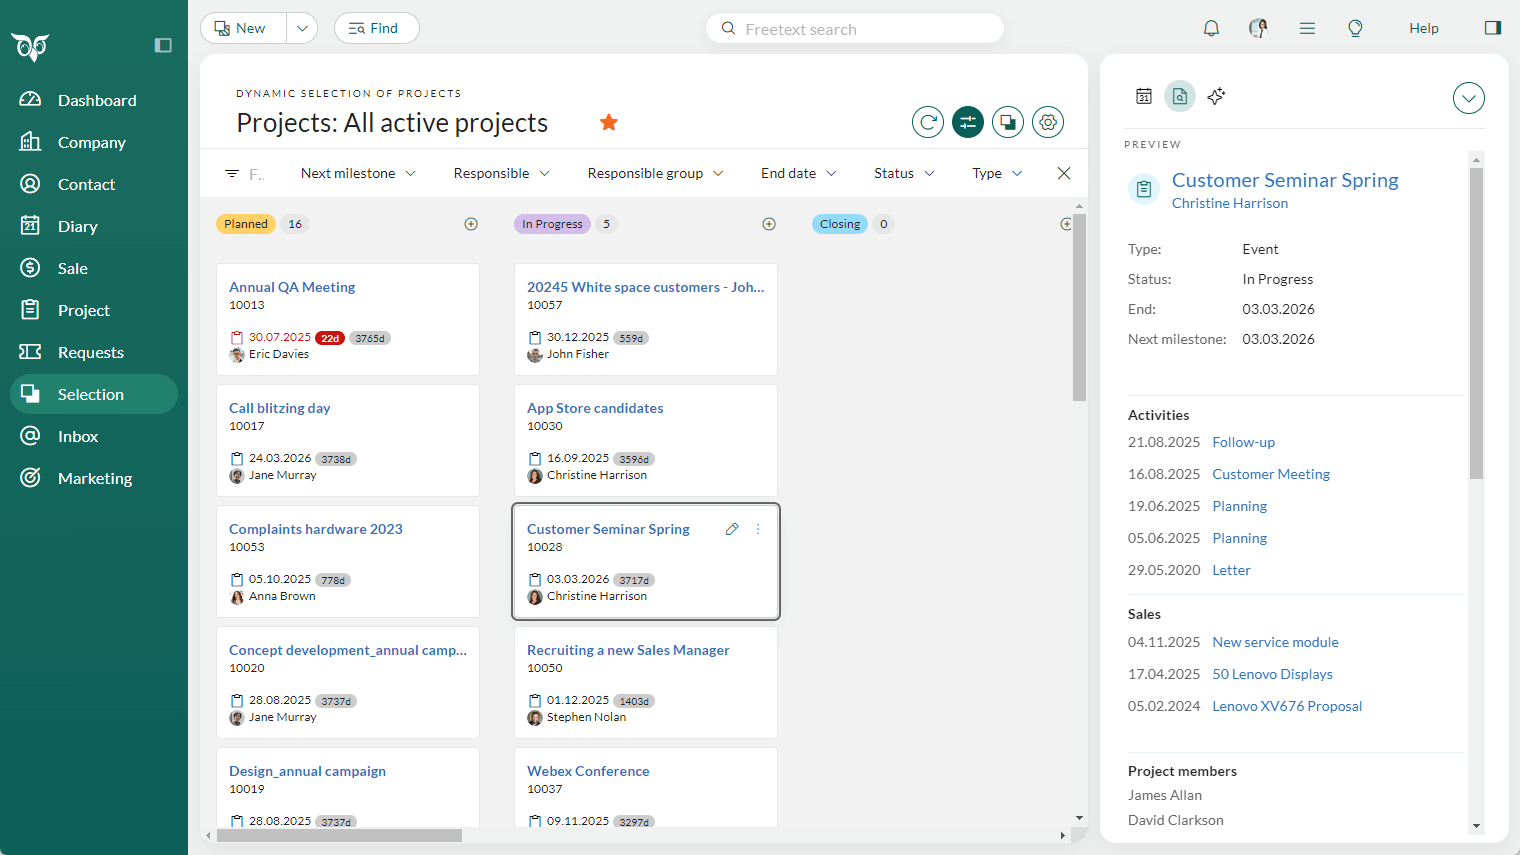
Board view presents your selection in a column-based layout using cards. You can group and filter the selection members (records shown on the board), and use drag-and-drop to move cards between groups.
The functionality is the same across supported entities: you can drag cards, open task menus, and adjust board settings. The available grouping and filtering fields vary depending on whether you are working with company, contact, sales, projects, or requests.

Open board view
Go to a selection.
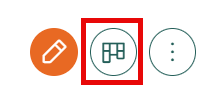
In the upper-right corner, select the board view icon ().
If your selection contains companies and contacts, the board view will only show one entity type at a time. To switch, click , then use the View entity dropdown to choose Company or Contact.
Work with cards
Click the card title to open the full record (for example, a sale card).
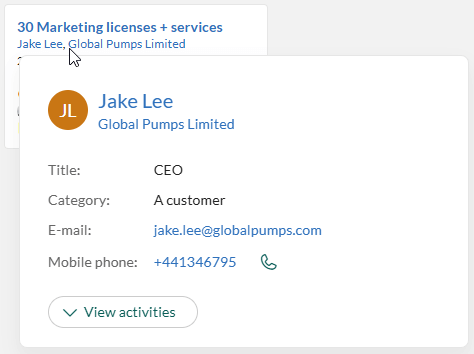
Hover over a name or company to preview contact details.
Drag cards between columns to update the grouping field (such as stage or owner).
- If subgroups are enabled, you can also drag cards between rows.
Click a card to view its details in the side panel. (Enable the preview by selecting it from the drop-down menu at the top of the side panel).
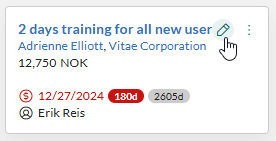
To edit a card, point to it and select the Edit button (). This opens the same edit dialog used elsewhere in SuperOffice CRM—without leaving the board view.
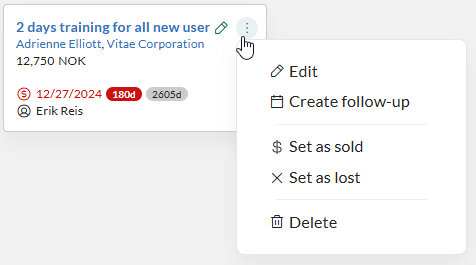
For more options, point to the card to reveal the Task menu (), then select it and choose from the available actions.
- Sales: Edit, Create follow-up, Mark as sold/lost, Delete
- Projects: Edit, Create follow-up, Create document, Mark as completed, Delete
- Requests: Edit, Close request, Delete
- Company: Edit, Create follow-up, Create sale, Move to next category, Delete
- Contact: Edit, Create follow-up, Create sale, Delete
Customize board layout
Group and subgroup
To choose which columns appear:
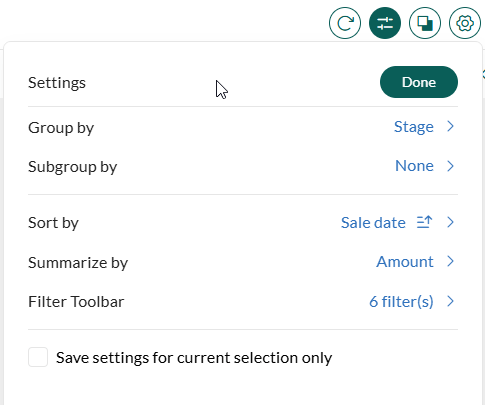
Select the settings icon ().
Select Group by.
Choose a field to define the column layout.
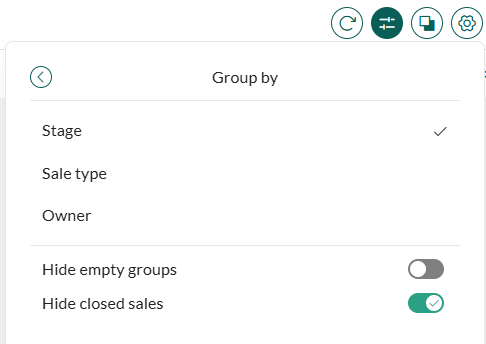
Select the back arrow () to return to the settings overview.
Optionally, choose a Subgroup by value to organize cards into separate rows within each column.
Optionally, select Save settings for current selection only to apply changes only to this board view.
Select Done to apply your settings.
Examples of grouping fields:
- Sales: Stage, Sale type, Owner
- Projects: Status, Responsible, Type
- Requests: Status, Request type, Priority, Owner
- Company: Category, Our contact
- Contact: Category, Our contact, Lead status
Sort cards in columns
Use the settings panel () to configure Sort by and Sort order, such as by sale date.
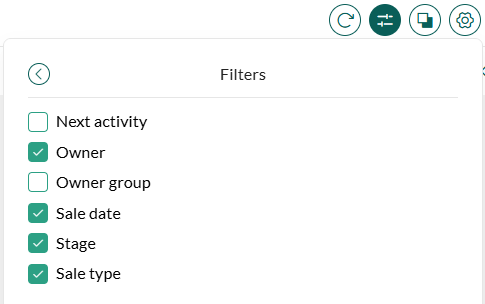
Set filters
Select to show the filter toolbar.
To choose which filters are available:
- Click to open the Settings panel.
- Select Filter toolbar and enable filters using the checkboxes.
- Click the back arrow () to return to the main settings and then click Done.
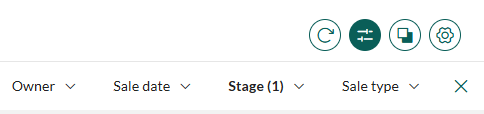
In the toolbar, expand a filter (for example, Owner) to show a list of items.
- Select or deselect items to include them.
- Select Clear at the bottom of a dropdown to reset that filter.
- Select the X on the right edge of the toolbar to reset all filters at once.

Examples of filters:
- Sales: Sale type, Owner, Stage, Next activity, Sale date
- Projects: Type, Responsible, Status, Next milestone, End date
- Requests: Request category, Owner, Status, Created, Deadline, Priority
- Company: Our contact, Registered date, Next activity, Category, Country
- Contact: Our contact, Owner group, Registered date, Next activity, Lead status, Category, Country
Summarize (sales only)
You can display totals for numeric fields in the board view for sales.
- Select to open the Settings panel.
- Select Summarize by.
- Choose a numeric field, such as Amount or Weighted amount.
The total value appears next to each column name, helping you track value distribution across stages, owners, or other grouping fields.
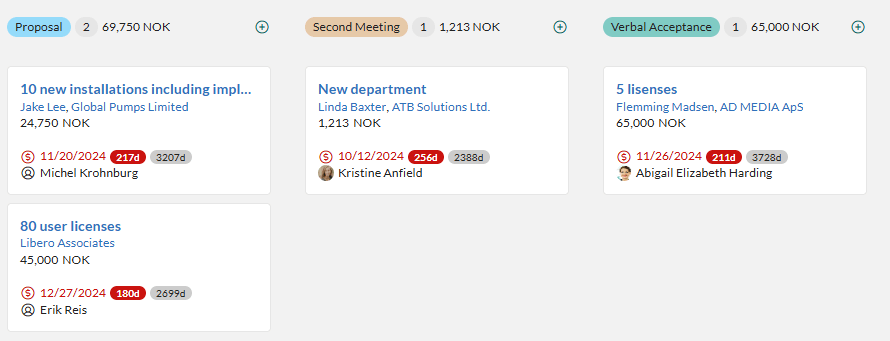
Sale date badge (sales only)
You can control what the gray badge on each sale card shows in the board view. This helps you understand aging at a glance—either how long a sale has been open or how long it has stayed in its current stage.
Select to open the Settings panel.
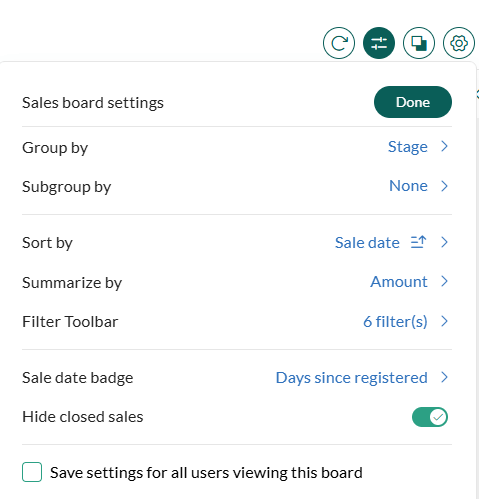
Select Sale date badge.
Choose one of the following options:
- Days in stage: Shows how many days the sale has stayed in its current stage.
- Days since registered: Shows how long ago the sale was created.
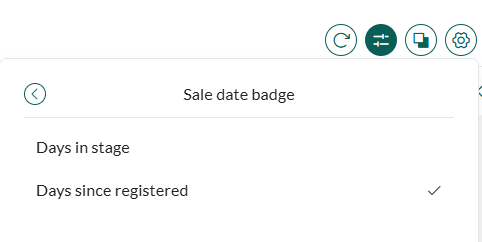
The selected metric appears as a gray badge on every sale in the board view. A red badge is still used to mark overdue sales.
Use cases
Board view supports different roles and workflows. Here are examples for sales representatives, project members, support agents, and managers:
Sales representatives
- Visualize your open sales and track where each opportunity is in the pipeline.
- Drag a card to another column to update the sale stage.
- Filter by sale date to focus on what needs attention now.
- Open the task menu to create a follow-up, or mark a sale as sold or lost.
- Quickly edit a card to update details, such as a new contact person.
Sales managers
- Visualize the entire pipeline and understand the distribution of sales across stages.
- Summarize by amount to support forecasting.
- Filter by sale type to focus on new business or specific campaign types.
- Group by owner to check workload per sales rep and rebalance using drag and drop.
- Use stage as group and sale type as subgroup to get a strategic overview by category and phase.
Project members
- Visualize your active projects and track progress through different statuses.
- Drag a card to another column to update the project status.
- Filter by next milestone or end date to focus on urgent deliverables.
- Group by responsible to see ownership of projects across the team.
- Open the task menu to create a follow-up or document, or to mark the project as completed.
Project managers
- Get a full overview of all projects to monitor status and identify delays.
- Summarize by type to compare customer projects, internal initiatives, or development work.
- Filter by responsible to balance workload among team members.
- Group by status to see how projects move through phases, or by type to align with business priorities.
Support agents
- Visualize your assigned requests and track them across statuses such as new, in progress, and closed.
- Drag a card to another column to update the request status.
- Filter by deadline or priority to work on urgent cases first.
- Group by status to follow progress, or by request type to focus on specific categories.
- Open the task menu to close the request.
Support managers
- Get a full overview of incoming requests and see distribution by status.
- Summarize by priority to ensure high-importance requests are handled quickly.
- Filter by category or created date to analyze trends in customer issues.
- Group by owner to monitor workload across agents and reassign requests as needed.
- Use status as group and priority as subgroup to get a structured overview for analysis and reporting.
Use grouping creatively to organize and act on data efficiently.
Troubleshooting and tips
New sales are missing: Click to reload the board view and fetch the latest data.
Filter toolbar not visible: Toggle the filter toolbar on or off using the icon.
A column is empty: You may have filtered out its contents. Check the active filters in the toolbar.
Cannot find a filter field: Open Settings () > Filter toolbar and enable the field you want to use.
Need to edit the selection itself (not a card)? Click to return to selection view. Edit and task buttons for the selection are not available in board view.
Search the board by name: Use the Filter by title field at the top to narrow down visible cards by name.
Save layout per use case: Select Save settings for current selection only if you want to preserve a specific board layout, filters, or grouping for one selection only.