Monitor your pipeline and forecast sales
To reach your sales goals, it is important to maintain a healthy pipeline. SuperOffice CRM provides two main ways to forecast sales and monitor progress: dashboard tiles and selections (Find).
These tools help you identify gaps, highlight stalled deals, and compare your actual sales to your targets—whether you work individually or in a group.
Monitor your pipeline with dashboards
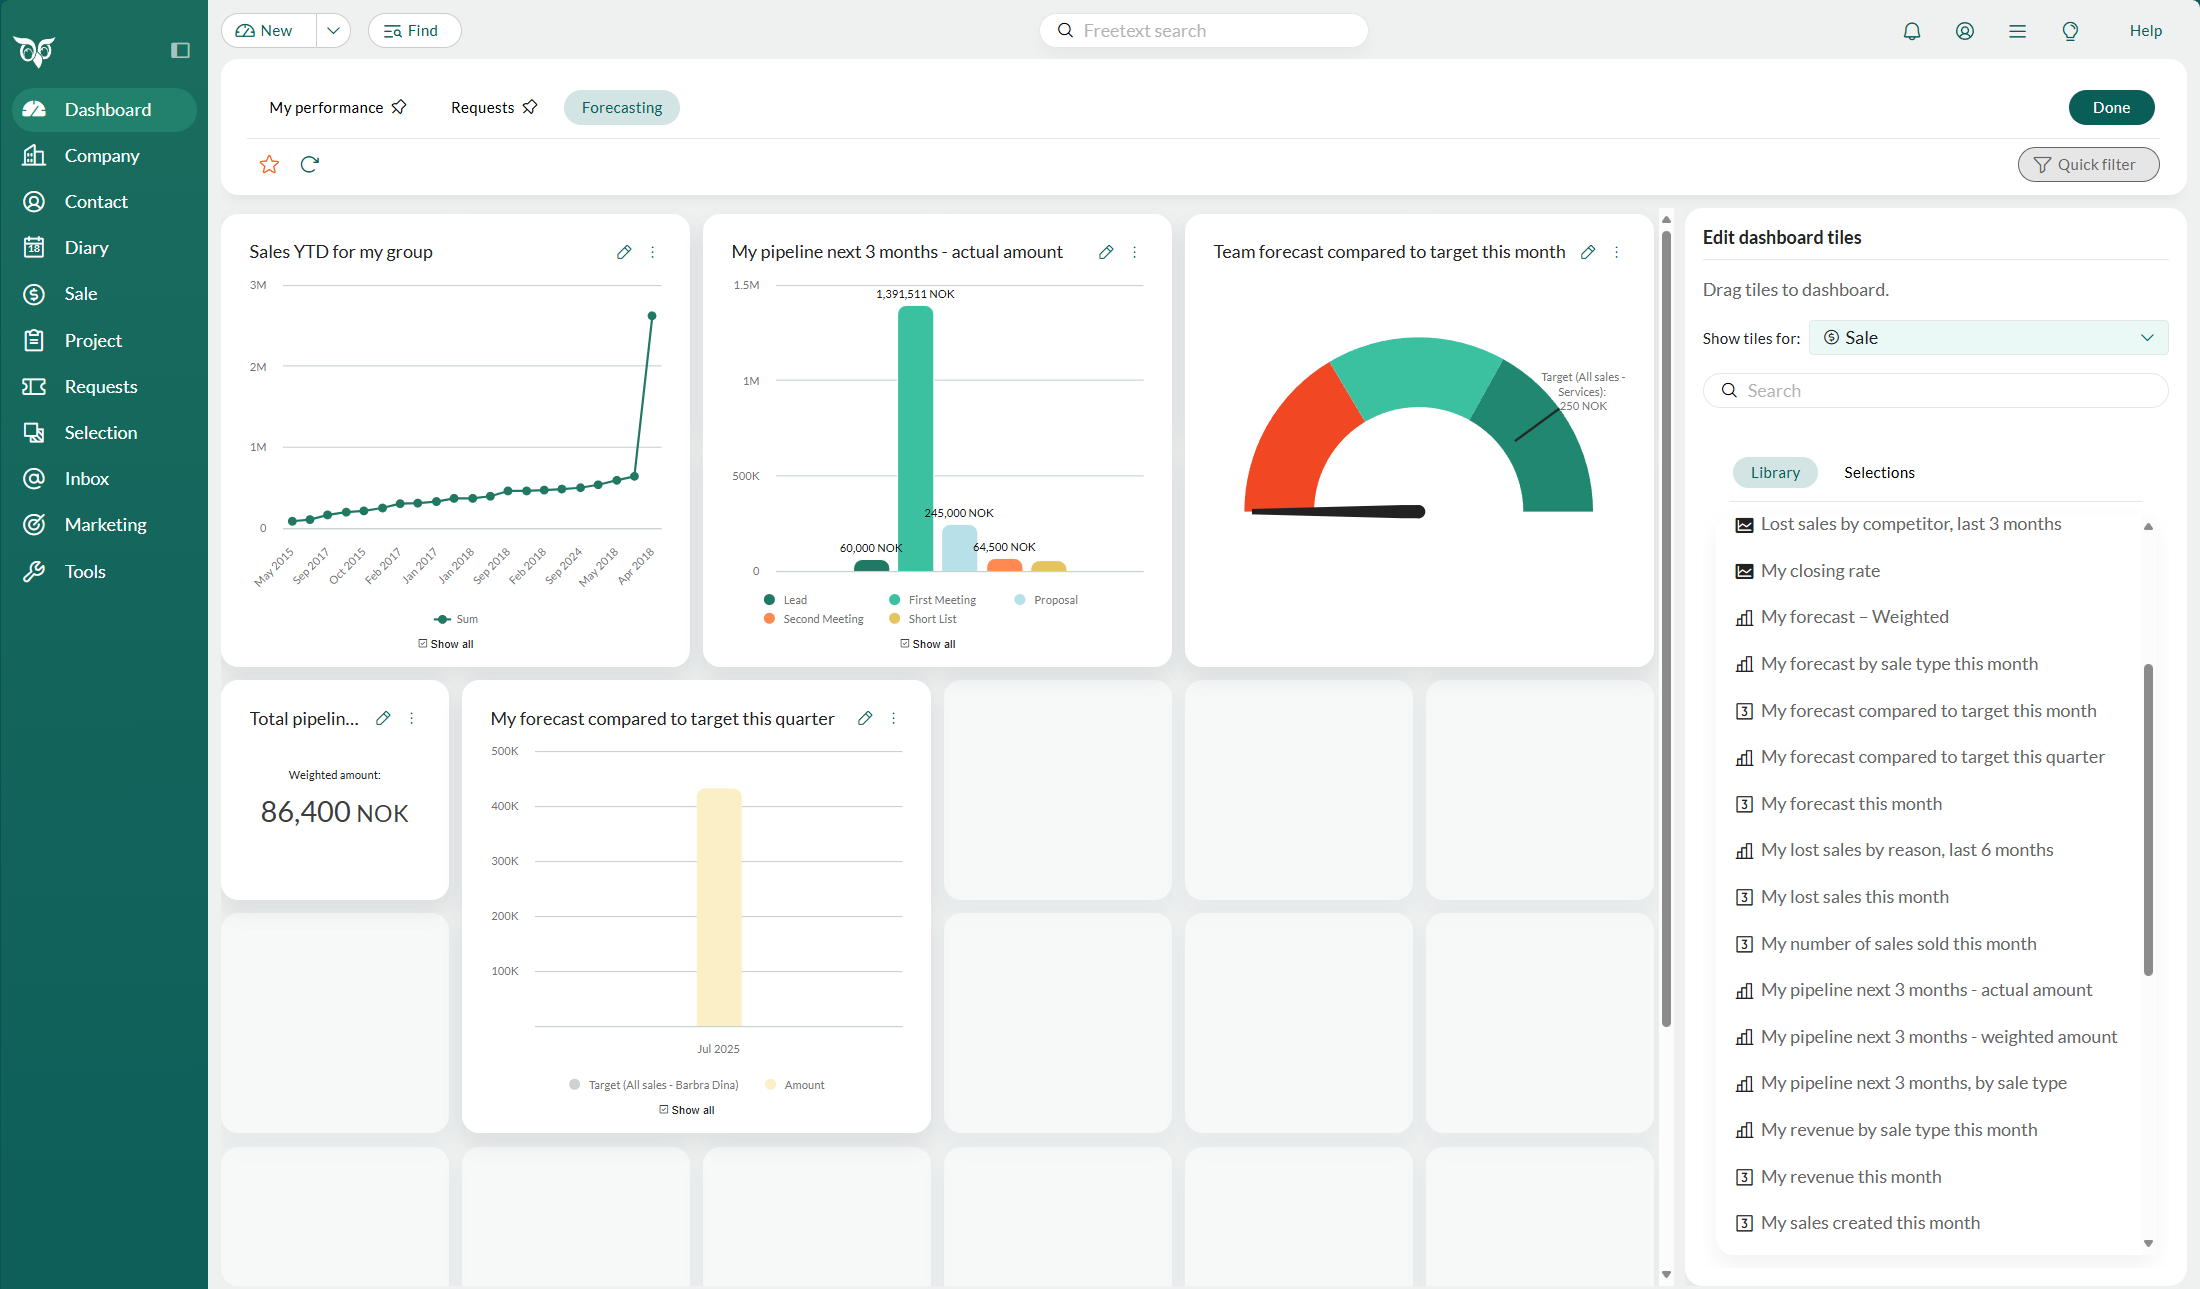
Dashboards give you a quick overview of key sales data. You can use tiles to track your own progress, group results, or specific pipeline metrics.

Common tile types for sales forecasting include:
- My forecast compared to target this month/quarter: Visualize your actual progress against set goals.
- Team forecast compared to target: Monitor how your team is performing against their shared targets.
- My pipeline next 3 months (actual or weighted): View upcoming sales, either by full or weighted amounts.
- My forecast by sale type: Break down your forecast by category or product line.
- Biggest open or sold sales this month: Identify high-value deals to prioritize or analyze performance.
- Group forecast / revenue this month: Track group-level sales activity and progress.
You can customize each tile by setting date ranges, filters, and comparing results to targets.
Analyze your pipeline using selections
The Find feature in SuperOffice CRM lets you search and find different types of data. This means that you can also use Find to forecast your sales. By using the Find feature you can filter out the data of any field in your SuperOffice CRM.
Examples:
- I want a list of all sales over €5,000 due to be completed next month.
- I want a list of all my stalled sales.
- I want a list of all sales proposals sent this month.
- I want a list of customers who have purchased a product that we are planning to upgrade.
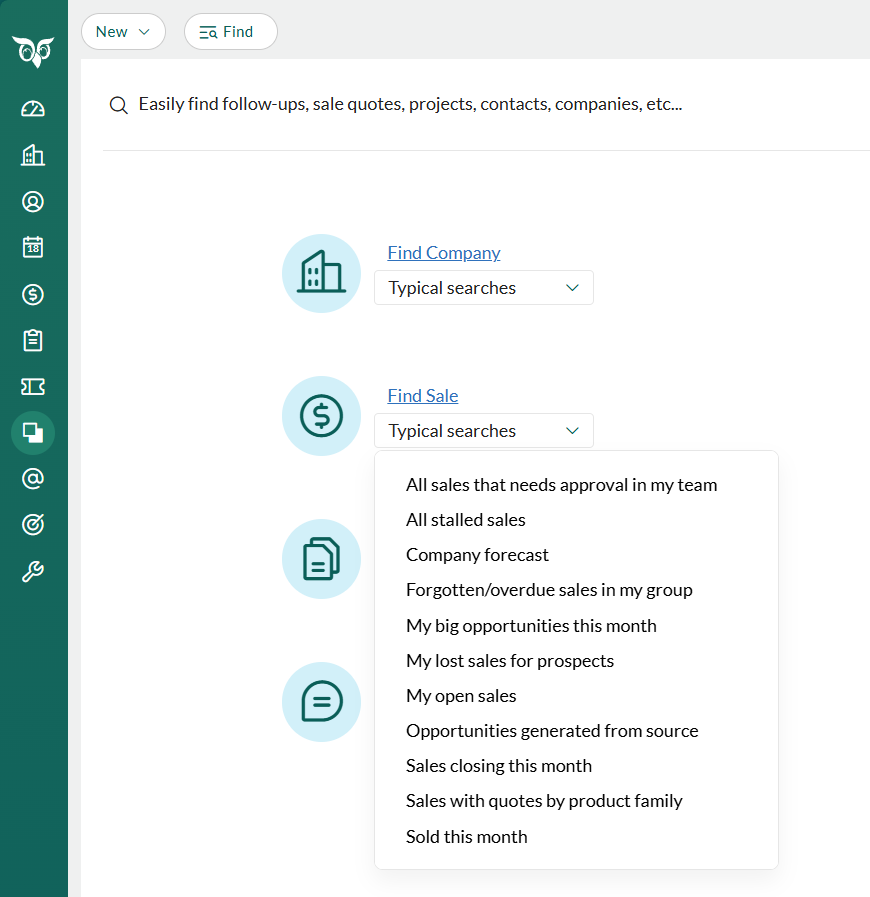
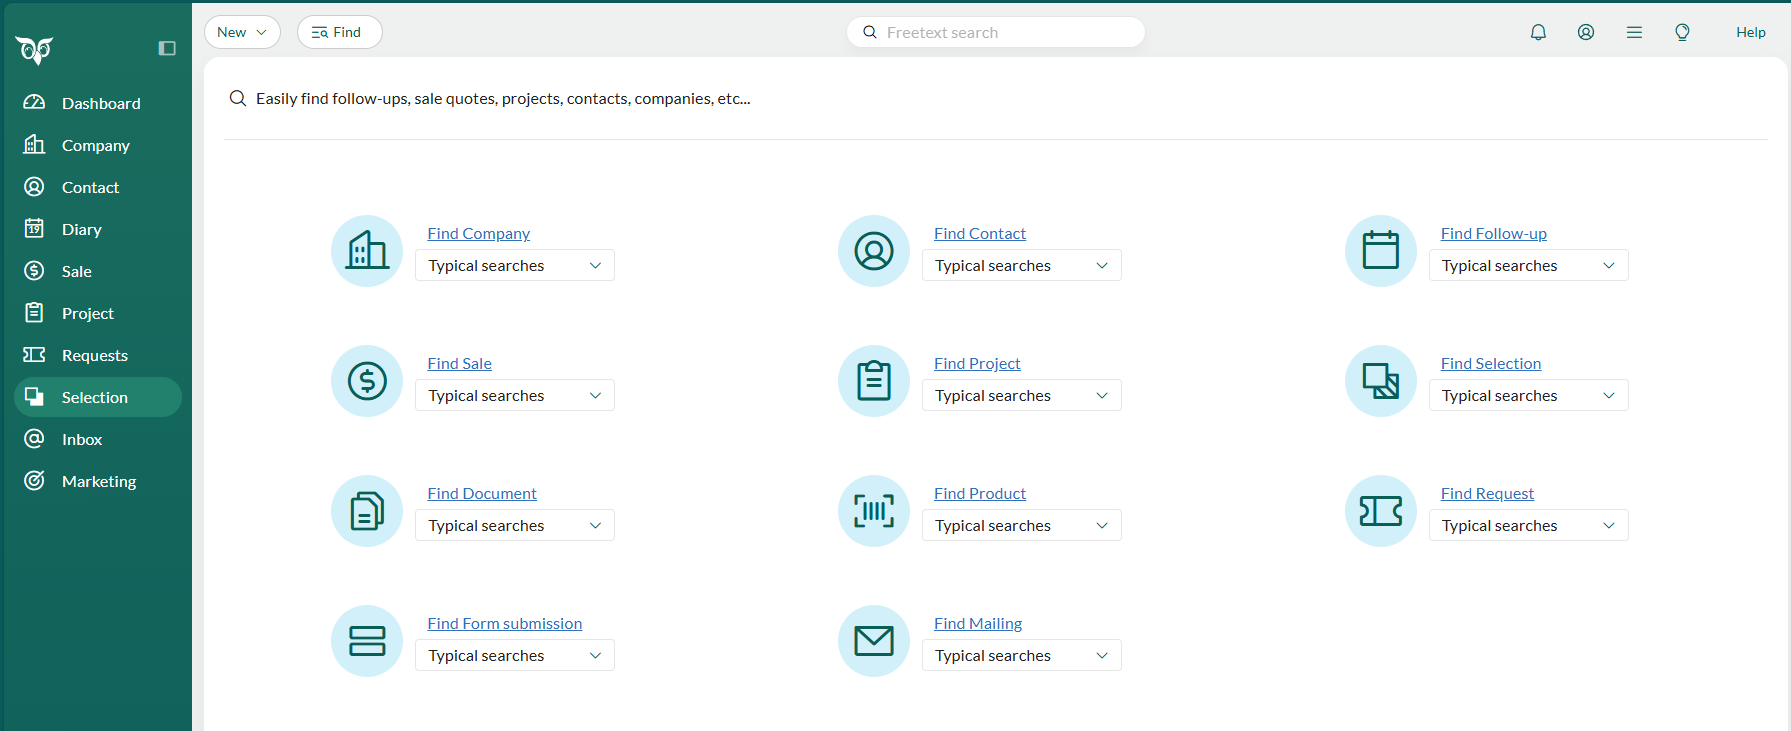
To get you going, the Find screen contains some ready-made search templates, called typical searches. These searches include overviews showing your sales opportunities and activities for the current month, as well as for the months ahead. There is also a selection of all sales that have been forgotten. Click the Find button to start.

Example
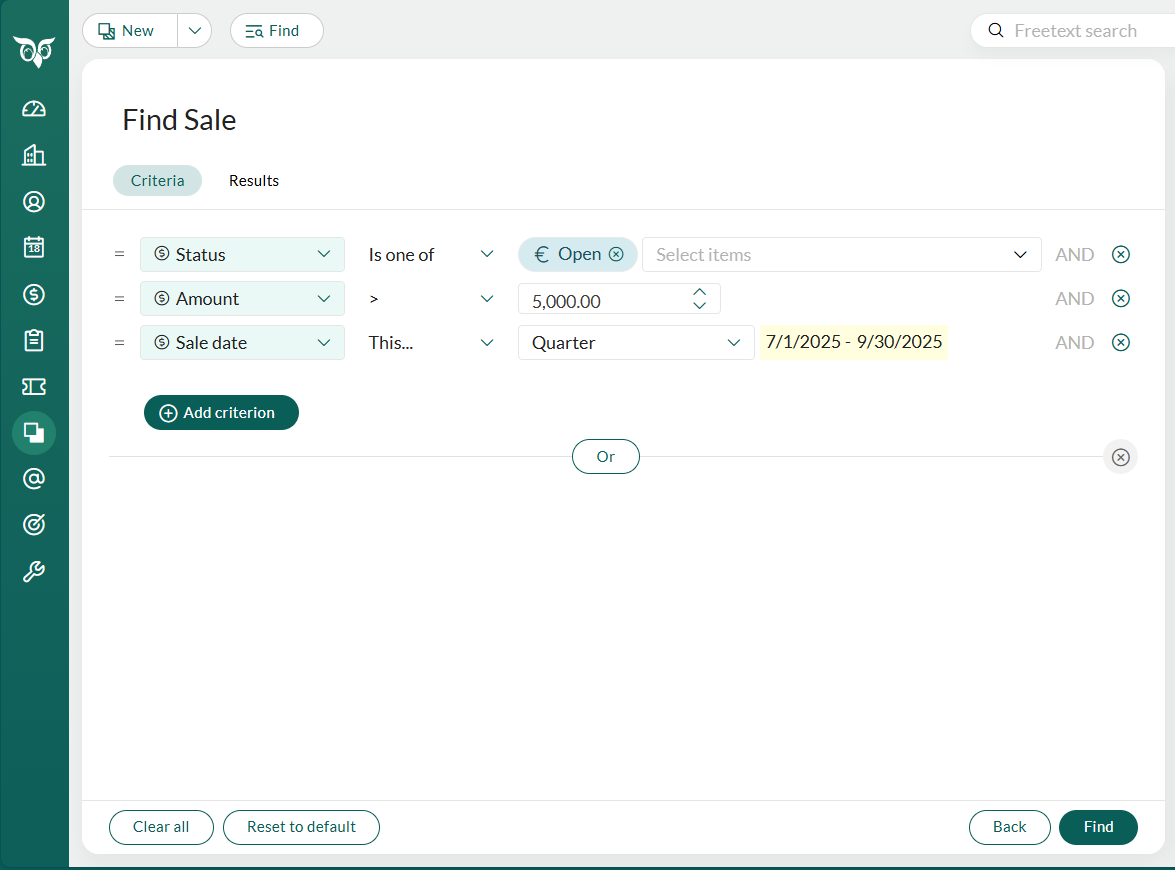
To demonstrate how you can use the Find feature for sales forecasting, here is an example of how to create a search for all open sales, made this year, that are larger than €5000:
Click on Find Sale to open a new search related to sales.

Here you can modify the predefined fields with new input, or delete unnecessary criteria altogether, or click Add button to add a new search criterion.
When you click Add, a drop-down menu will appear. Click on Sale in the drop-down menu. Then select the field called Amount.
Click on the second field that currently shows you the = sign. Choose the sign >.
Add the value that has to be met. In this case, greater than €5000. Click on the third field and add 5000.

To add more criteria just repeat this process.
Press Find at the bottom of the screen to see all your open sales opportunities with a value larger than €5000.