Core CRM and Sales 11.7 update
Dashboard - Valuable to your work
In a busy working day, it's incredibly helpful to have a quick overview of the things that matter most - whether that's sales, activities, or requests you're handling for your companies and contacts. With the Dashboard, you can create exactly the overview you need to stay on top of your sales, tasks, follow-ups, and deadlines.
Here's a quick look at how the Dashboard can help make your day a little easier, a little less hectic, and - most importantly - help ensure that nothing important slips through the cracks.
Dashboard - Quick filter in dashboard
Quick filter allows users to apply flexible filtering options across various data tiles. This minimizes the need to create separate dashboards for data that you would like to visualize, instead quickly adjust the views without navigating away from the current dashboard. All list and date fields are available to use as quick filters.
The dashboard owner - as well as dashboard administrators - can add the desired quick filters. Individual users can then adjust these quick filters to tailor the tiles content to their own needs.
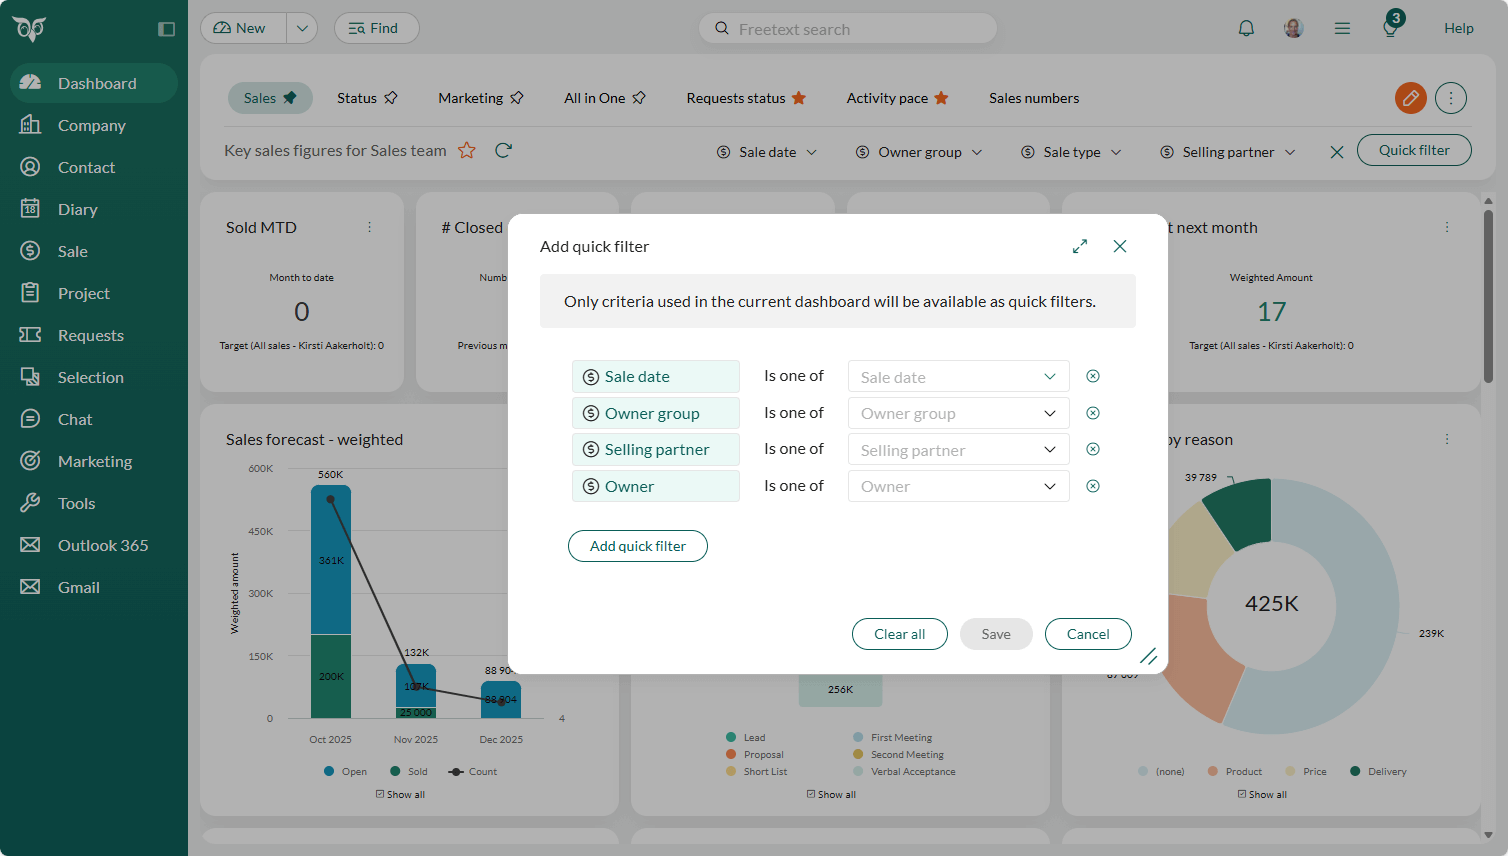
Note
You can add up to five quick filters in a dashboard. This limit ensures that all filters remain visible and it's less complex.
Dashboard - Load a tile again on time outs
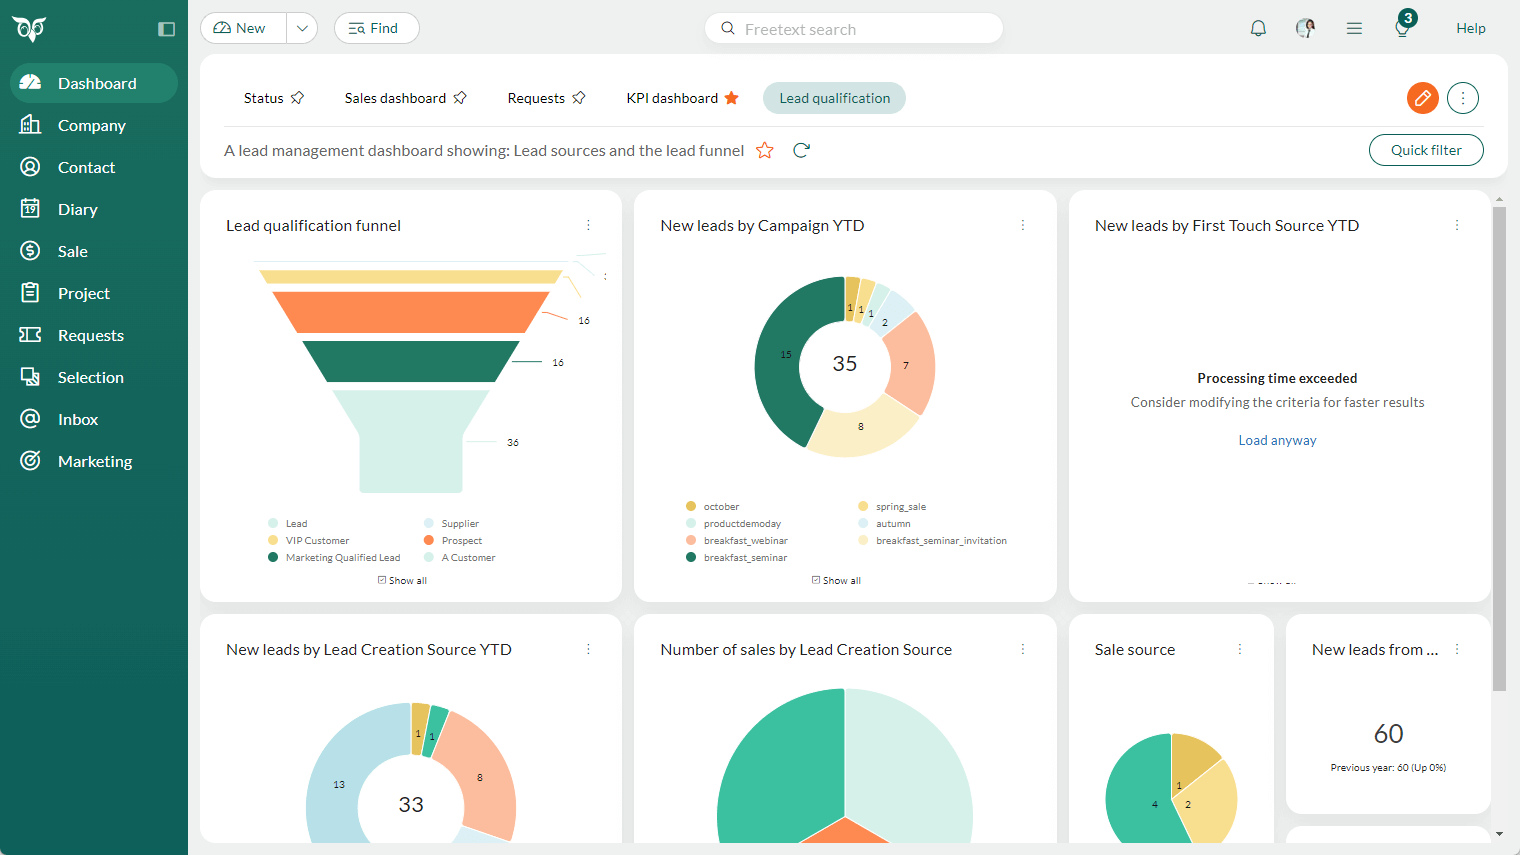
Loading a large dashboard with tiles based on complex datasets can put a strain on the system. Instead of making you wait for everything to load, the system introduces timeouts on the heaviest tiles—giving you less waiting time and more flexibility to review the rest of your dashboard.
Tiles that contain a lot of data may time out if they take longer than 15 seconds to load. If you still want to view the content of a timed-out tile, simply click the reload button for that specific tile. If the tile has not loaded within 5 minutes, it will time out again.
Timeouts may also occur in the Layout tab when editing a tile, as well as in the Chart tab in Selections. In these cases too, you can reload the tile whenever needed.
Note
If certain tiles consistently time out, consider adjusting the dataset to improve loading performance.
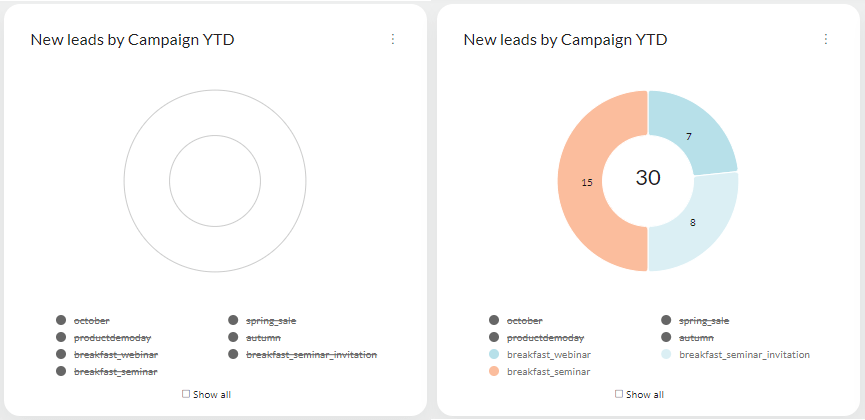
Dashboard - Show all or none of the legend
A new Show all checkbox lets you check or uncheck all legend items at once. This saves time when filtering your chart using the legend.
Simply uncheck Show all, then select the specific legend items you want to display. When you're done, click Show all again to restore the full view.
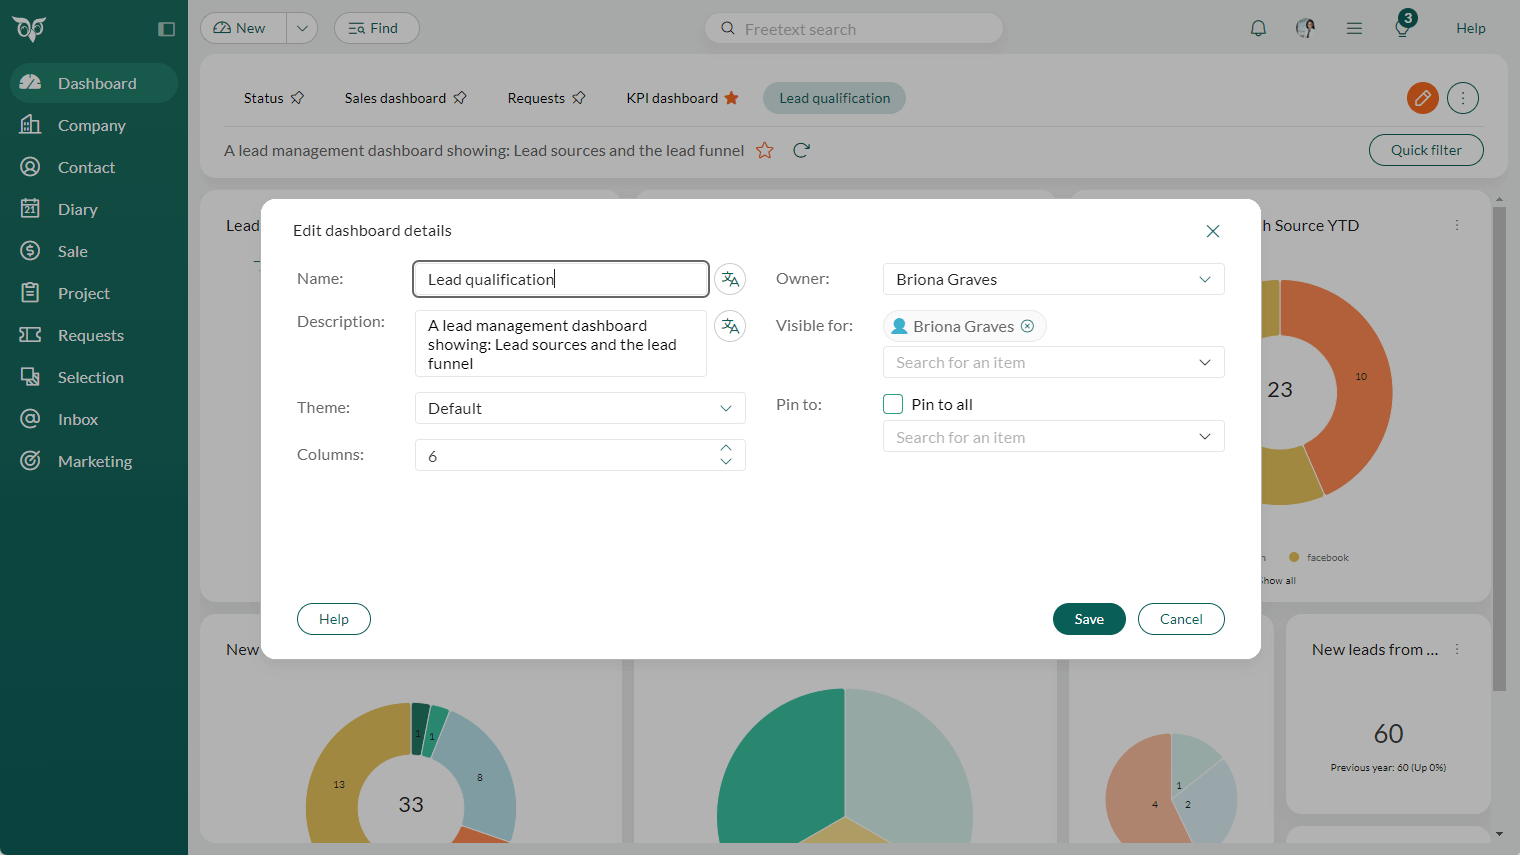
Dashboard - Administrator options for a dashboard
As a dashboard administrator or general administrator, you have full access to manage, edit, or delete dashboards to support users more effectively.
Under Settings and maintenance > Roles, you'll find both Data rights (Dashboard) and Functional rights for Dashboards (Dashboard Administrator and General Administrator). These rights allow you to:
- Edit dashboards belonging to other associates
- Change dashboard owners
- Manage who can see the dashboard (Visible for)
- Pin dashboards for user groups or specific users
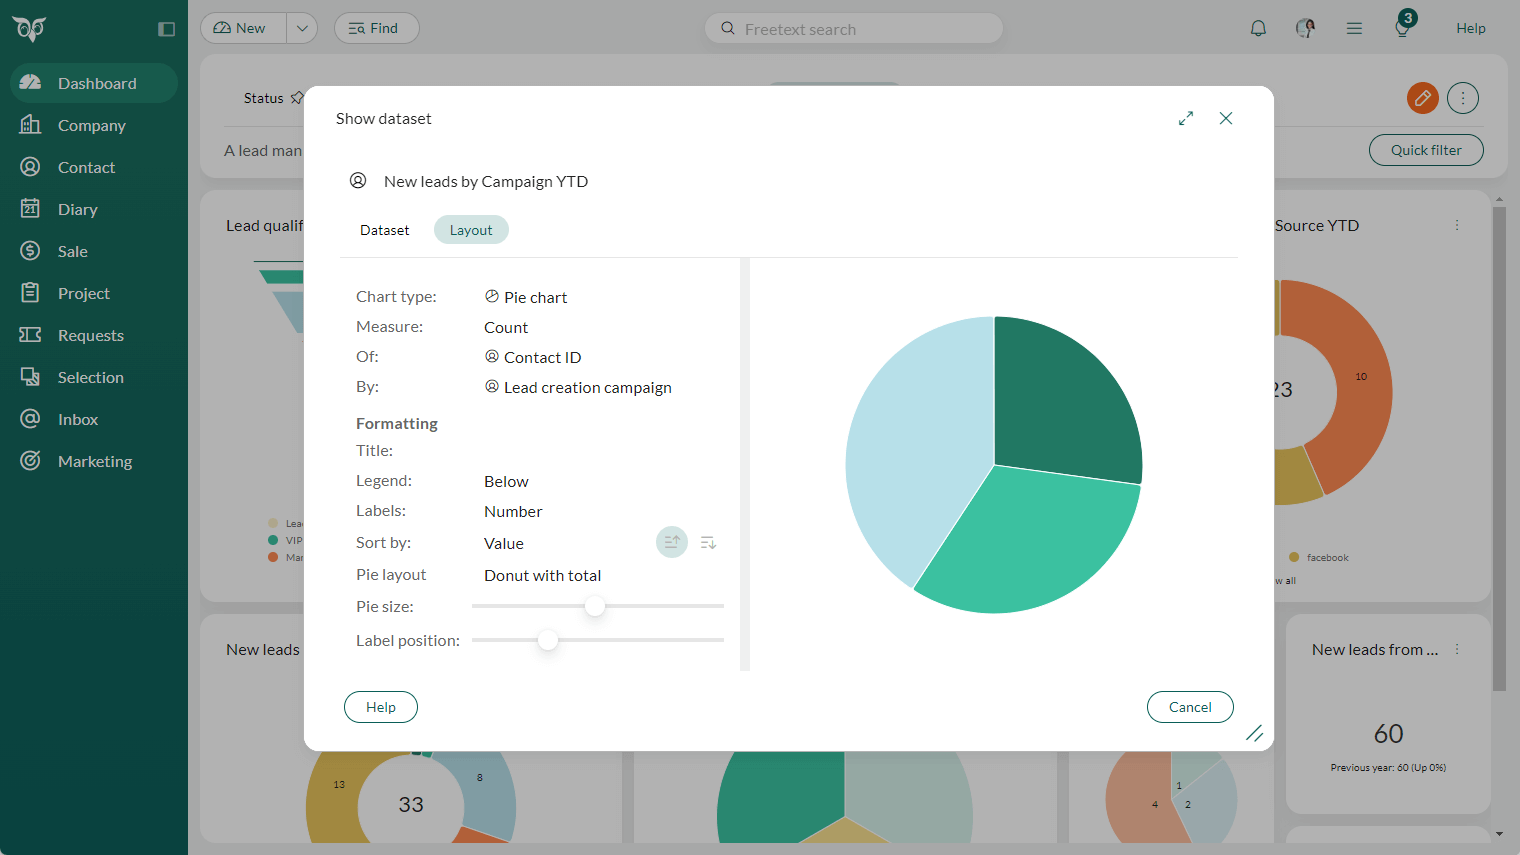
Dashboard - Tile details layout with chart type and dataset
The Layout tab of a tile now provides a clearer overview, helping you understand how the tile is built.
In view mode, click Edit on a tile and select Show dataset to inspect both the Dataset and Layout tabs. The Layout tab also displays the chart type as an icon, making it easier to understand the visual style at a glance.
This is especially helpful when a tile times out, allowing you to review the criteria and adjust the dataset without loading the full chart.
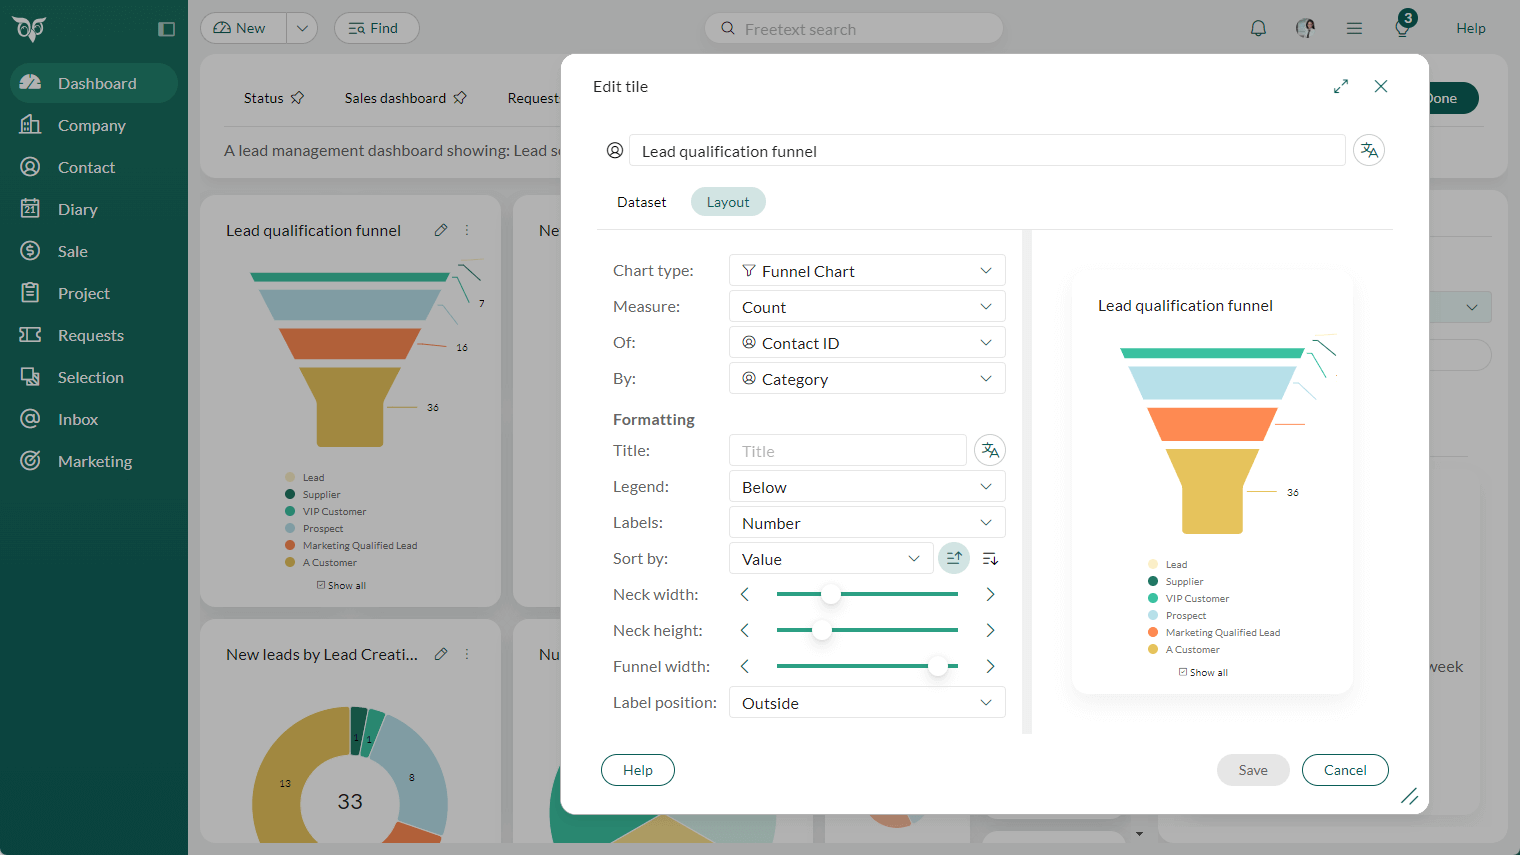
Dashboard - Funnel tile showing progression
A funnel chart gives account managers a clear view of lead progression and status, helping them prioritise opportunities more effectively.
You can add a funnel tile by selecting a default option such as Contact - Lead qualification funnel or Sale - My forecast this quarter. Alternatively, start with a blank tile and customise it to your needs.
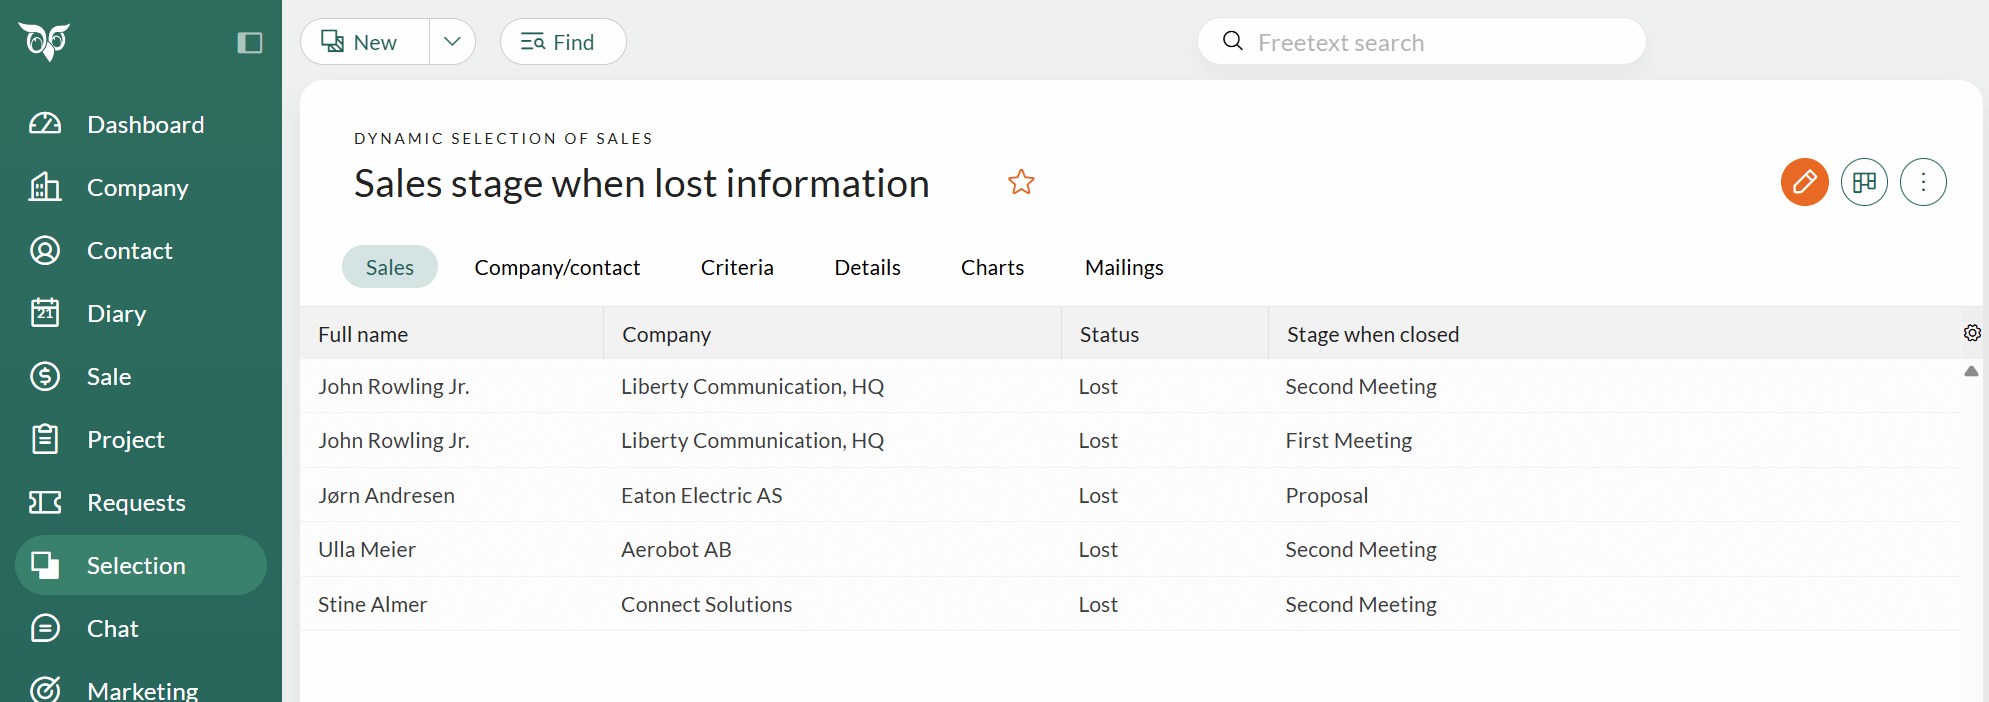
Dashboard - Show the Stage when closed
For closed sales you have access to a field called Stage when closed. This field can be used as a criteria or a column, or shown in a tile in dashboard and graphs. The field shows which stage the sale was in when it was marked as sold or lost. This gives valuable insight into where deals typically succeed or fail.
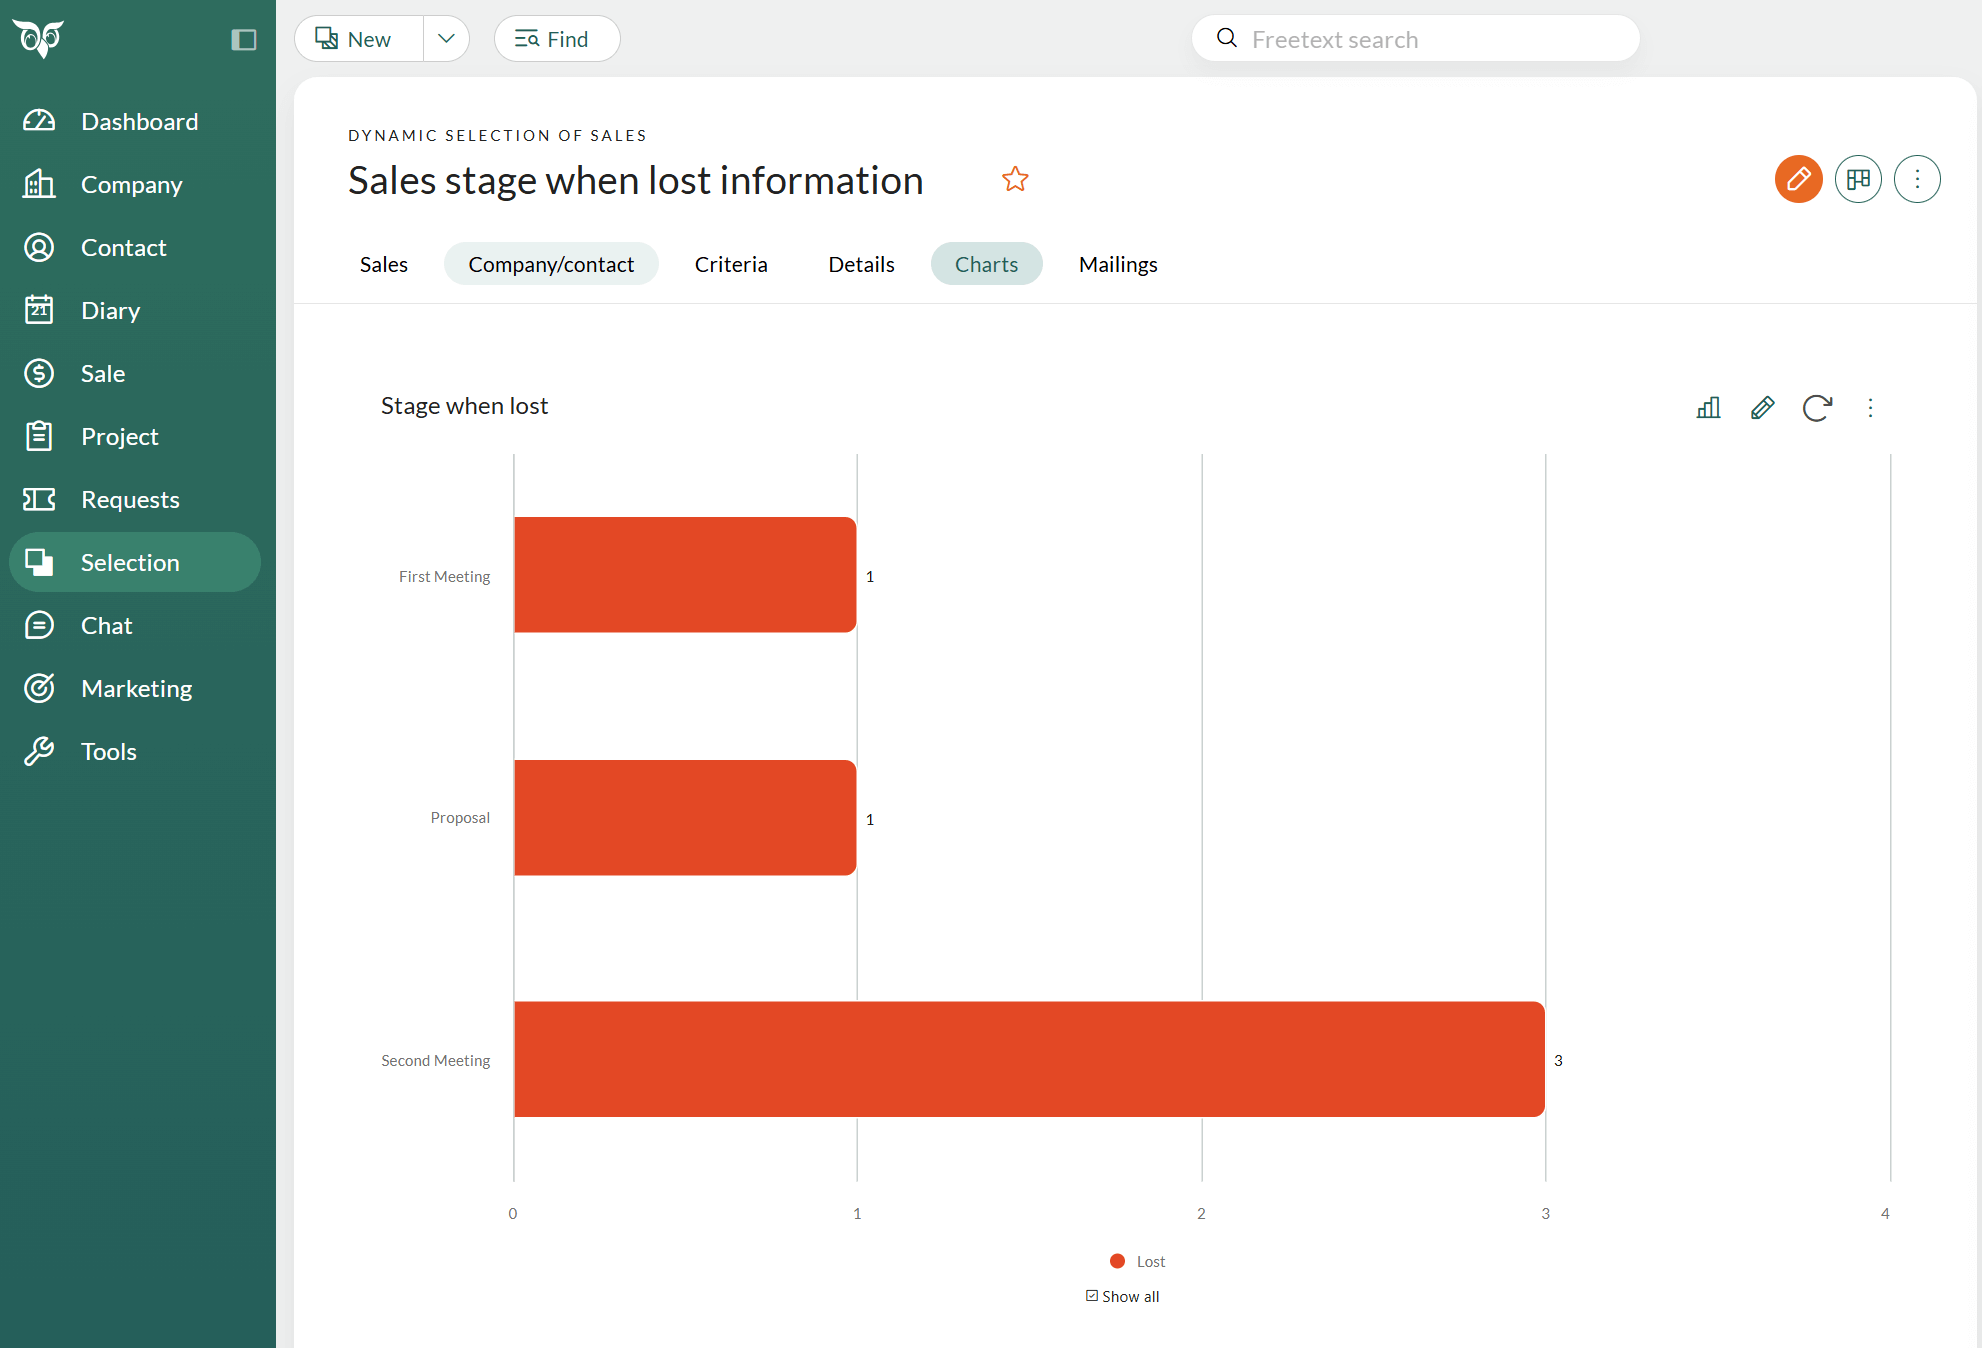
Choose the field Stage when closed as a column or as a criteria in Selection.
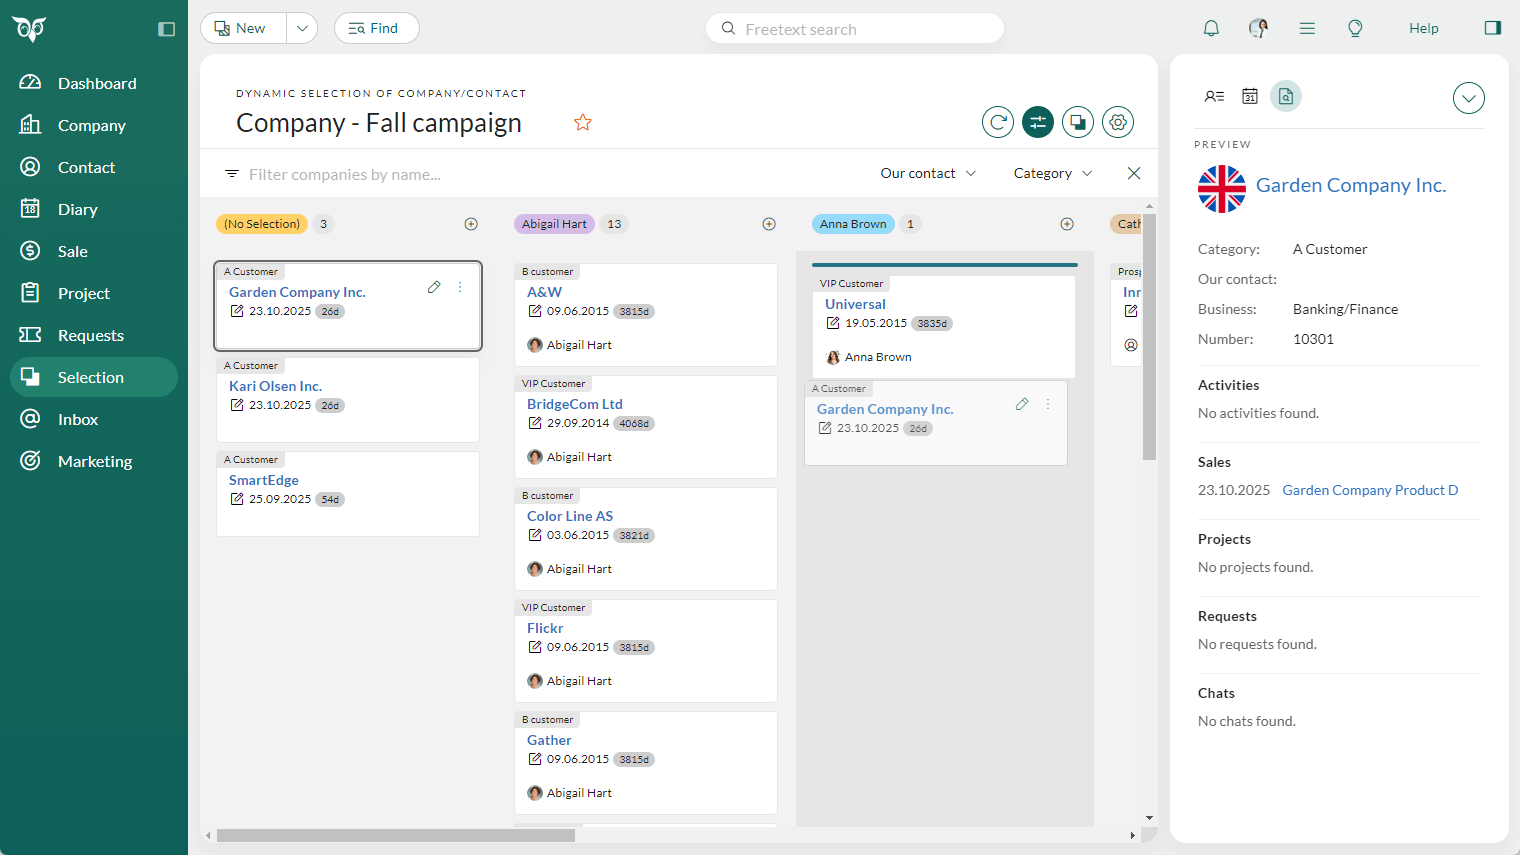
Selection of companies/contacts - Board view grouped by Our contacts to prevent Lost leads
To ensure that no leads fall through the cracks, it's essential to quickly identify which marketing qualified leads have not yet been assigned to a sales representative. The "No selection" grouping in board view (when grouped by Our contacts) highlights companies that haven't been assigned an owner and are not currently being followed up by sales.
Go to your selection of contacts/companies, select Board view and make sure you have grouped your board view by Our contacts, and you will see the No selection column. This allows you to quickly drag and drop unassigned contacts/companies to the appropriate owner.
It's a simple and efficient way to distribute new leads and keep your pipeline moving smoothly.
Tip
Board view will only group on associates specified as Our contact within your selection data. If you cannot see the associate you want to drag-and-drop a company/contact to, open the card for edit and set the correct Our contact value. After saving, that associate will appear as its own group. If there are no unassigned companies/contacts in your selection, the No selection column will not be shown.
Selection of sales - Board view Setting for displaying days in stage
You can do a lot in the Board view setting to make the board work better for you.
In the Settings for board view for sale selections, you can select two different options for the sale date badge, the number in the grey badge displayed behind the sale date on the card:
Days in stage: shows the total number of days the sale has been in this stage. This is prevent too slow moving forward.
Days since registered (default setting): shows number of days since the sale was first registered.
![]()
Tip
Use the checkbox Save settings for all users viewing this board to apply your fine-tuning to everyone. This ensures that all users of the selection see the same customised board settings.
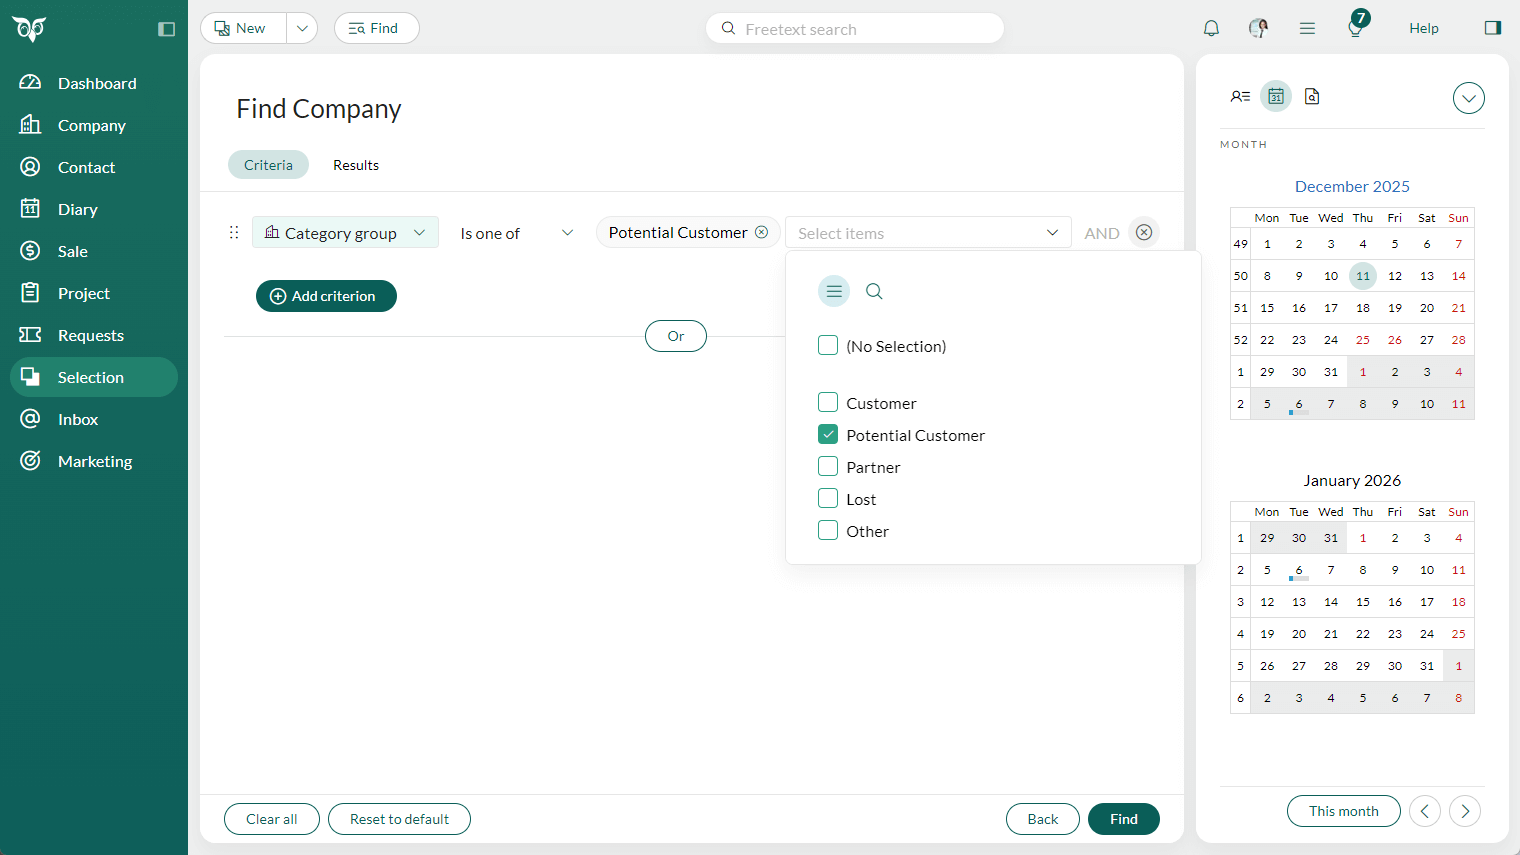
Find - Search for category group
When you use many different categories for customers or leads, searching for them individually can become time-consuming. By assigning each category to a category group in Settings and maintenance, you can simplify your searches dramatically.
With Category group available as a search criteria, you can quickly find all customers or leads belonging to a specific group - such as Customer, Potential customer, Partner, Lost, or Other - without needing to select every category one by one.