Analyze your flow results
SuperOffice gathers statistics and results for each flow you run.
Steps
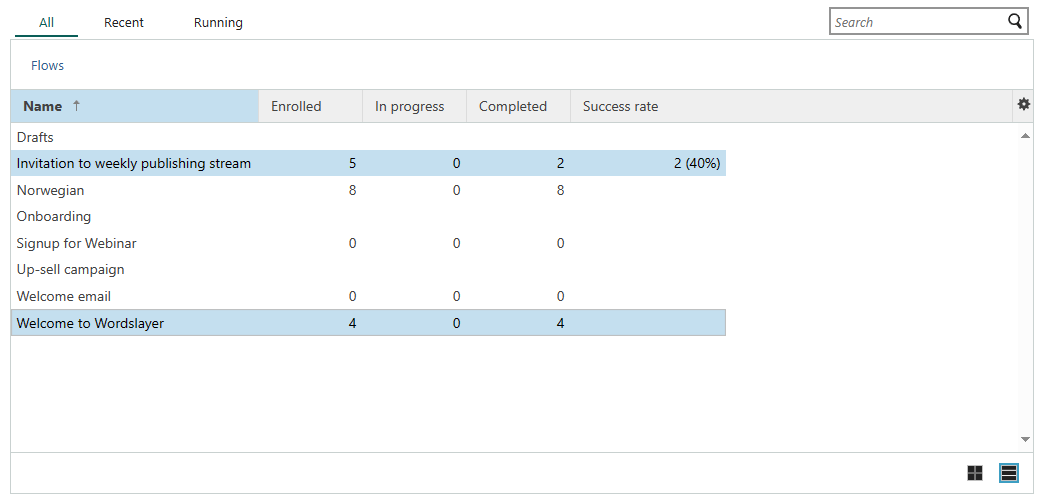
To view statistics about your flow, go to the Flows tab and click the flow in the list. The View flow screen opens.
Tip
Click the Refresh button to update the flow statistics.
Tabs with flow statistics
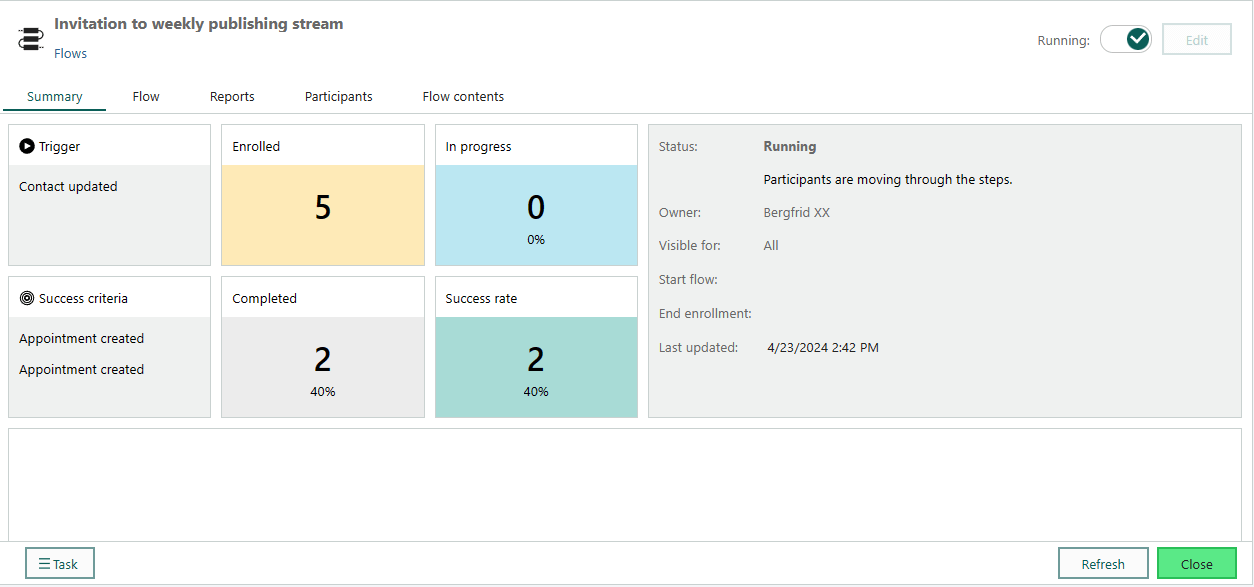
Summary: Essential information about the flow and some key metrics
- Trigger: The flow's starting point defining WHEN a person is suggested as a participant.
- Success criteria: What the user wants to achieve by this automation.
- Enrolled: Total number of added participants, all statuses.
- In progress: Total number of participants with status = active.
- Completed: Total number of participants with status = Finished / Finished with success.
- Success rate: Percentage of all participants with status Finished with success.
Essential info: status (Not running/Running/Pause), owner, visible for (associate/group/all), last updated, description
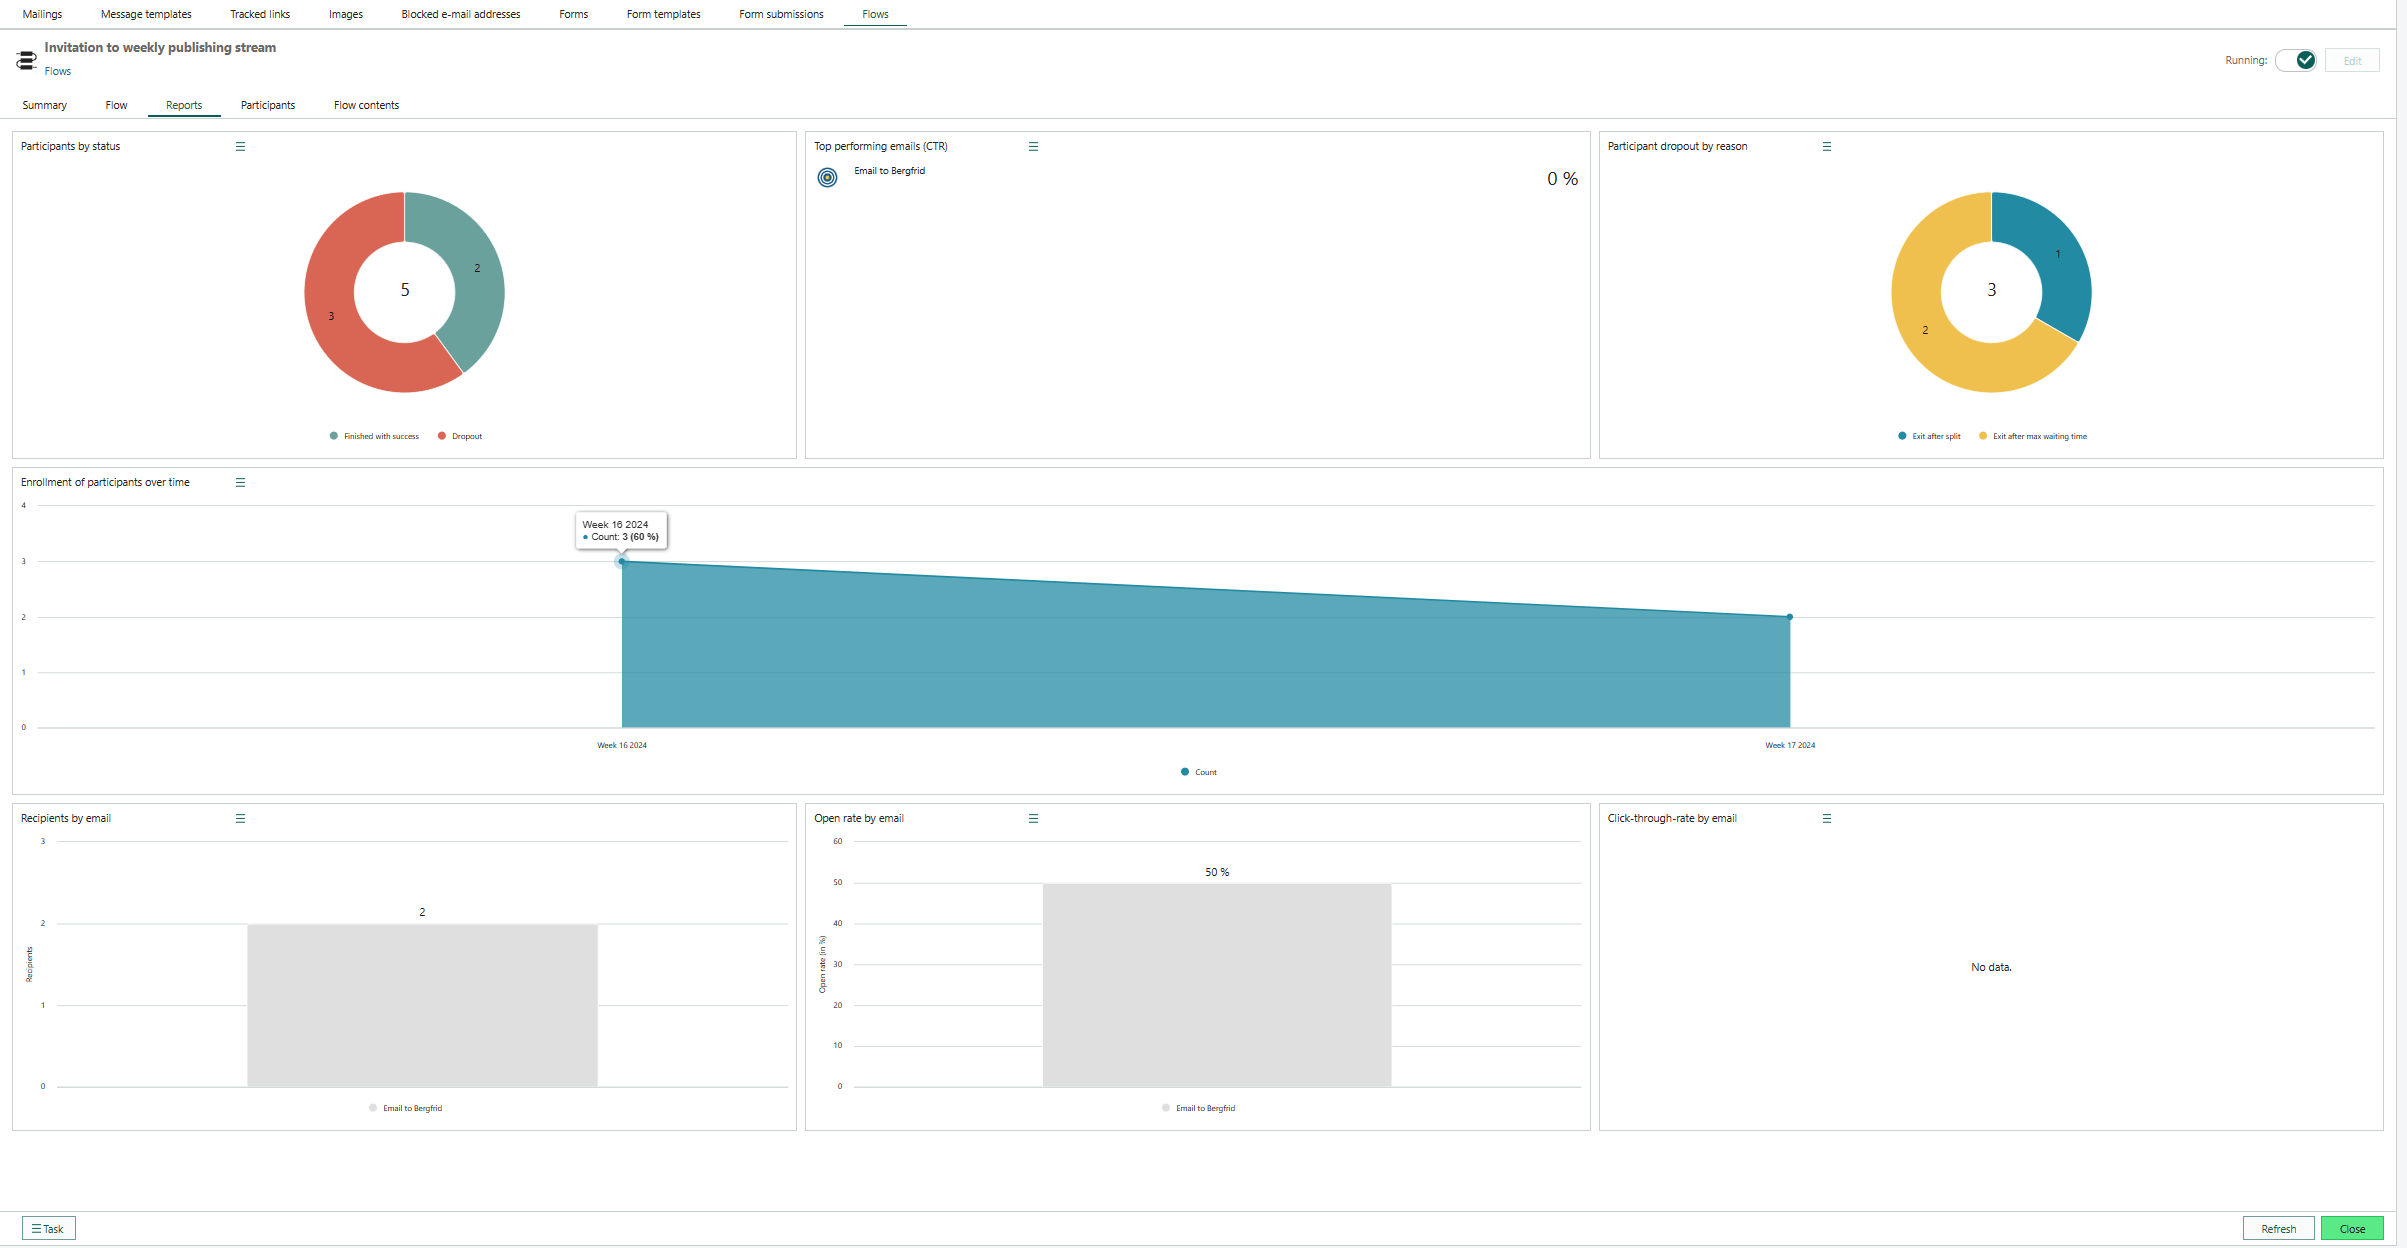
Reports: Displays charts with statistics for the flow, used to monitor its performance. A read-only dashboard with predefined tiles. The dataset is restricted to the current flow - no filtering.
Participants: Presents a list of all participants within the flow.
Related content
Compare campaigns/flows
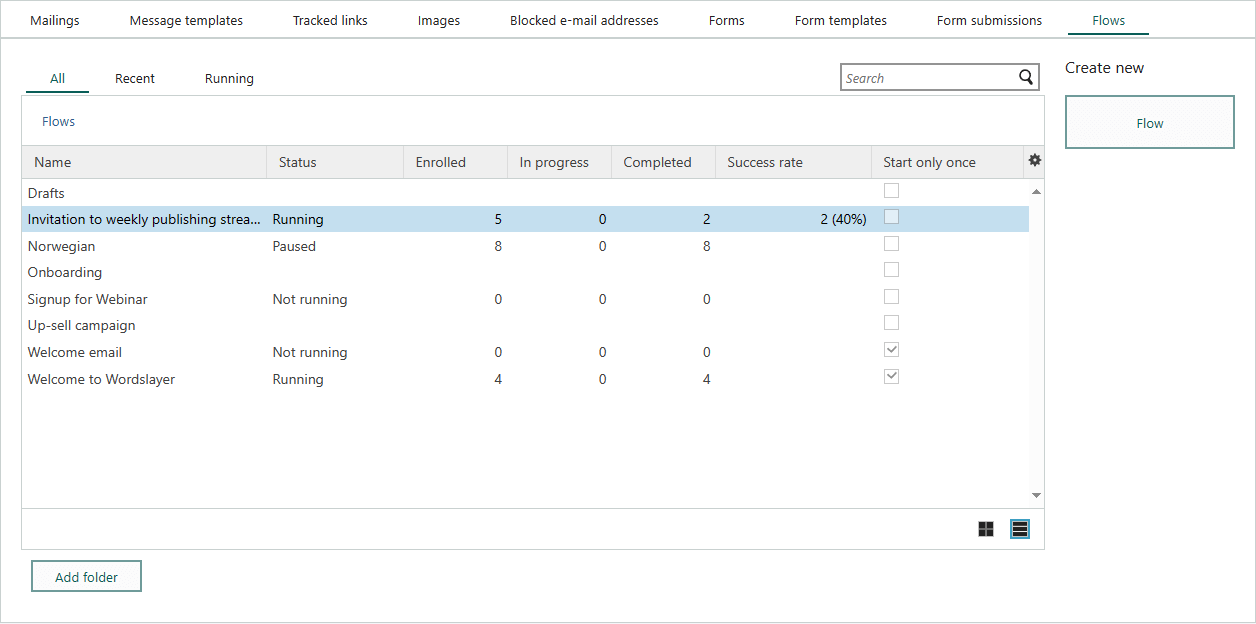
Go to Marketing > Flows and select archive mode.

Check status of current flow
In the View flow screen, the status is visible in the header and on the Summary tab.

Check status all flows
Go to Marketing > Flows and select archive mode ().

Check message performance and engagement
Go to Marketing > Flows > Reports.

Report tiles
- Recipients by email
- Open rate per email
- Click-through rate per email
- Participants by status
- Participant drop-out reason
- Enrollment of participants over time
- Top performing emails (CTR)
Which links are clicked and by whom
Go to Marketing > Tracked links. See Explore link clicks.