Debugging the Web application
How do we debug the web client? For starters, all the web browsers have developer tools either built-in or available as a plugin.
- Firefox: Download the Firebug Plugin
- IE8+: Built-in (F12)
- Chrome: Built-in (Ctrl-Shift-J)
- Safari: Built-in (Ctrl-Alt-I)
With these tools, you can get an overview of the current HTML styles and execute JavaScript code. In addition to the browser debuggers, we have some simple tools to help you make sense of what's happening inside.
Diagnostics viewer
Diagnostics.aspx

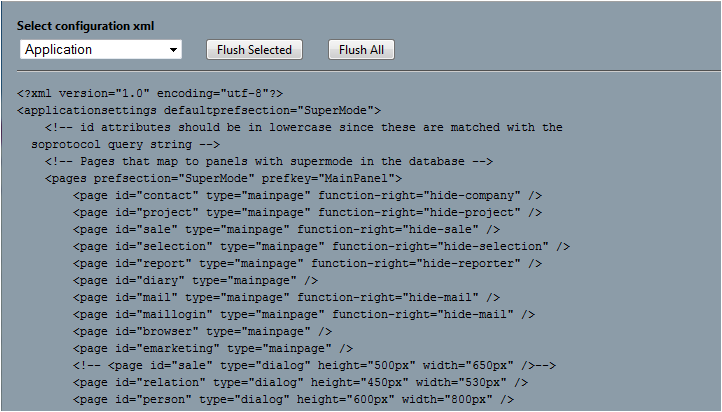
This webpage can be used to check whether your config file modifications are being picked up.
The Debug window
If you want to debug closer to your codebase, you can use our Debug window to catch trace messages from the application:
debug.trace("My trace", "My category");
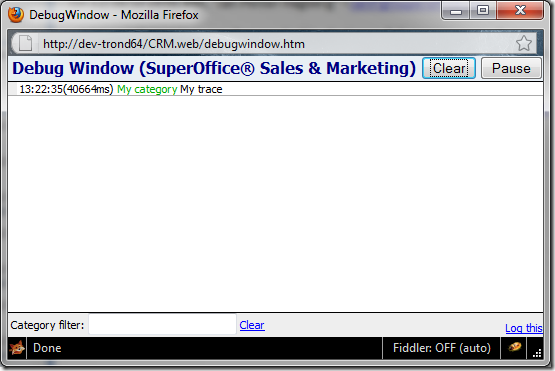
This JavaScript code above will produce the following output:

How to open the Debug window
There are several ways to open the debug window. Type the following into the address bar of your favorite browser:
javascript:debug.openWindow();
The debug window is now active for the current page and will receive all traces from the code.
Note
If you want to use this for dialogs, a new debug window must be opened for each dialog.
Go ahead and enter the following lines into the address bar (one at the time):
javascript:debug.trace("My trace", "My category");
javascript:debug.warning("My warning trace", "My category");
javascript:debug.error("My error trace", "My category");
You should see something like this in your debug window:

The output is quite straightforward:
- Time of trace
- (xxxms) Time in milliseconds since the last trace was written
- Category in green (Clickable, allows filtering on a specific category)
- Trace text
When you open the Debug window, you will notice a lot of traces going on when navigation the application. We utilize the trace output a lot. Take a look at the combined script file to check it out.
Note
The debug window will survive a refresh of the page it's connected to.
Create a keyboard shortcut (socustom.js)
Note
This will only work in S&M 7.Web
During the loading of a new page, the application will be looking for a JavaScript file named socustom.js in the root folder. Any scripts inside this file will be executed for the main page and any dialogs opened.
Let's say we want to open the Debug window when we press Ctrl-F9 inside the web application.
To enable:
Create a new file socustom.js and place it in the root folder.
Add the following JavaScript code to the file:
$j(document).ready(function() {
  KeyPressHandler.AddKeyPressListenerByKeyCode(
    120, //F9
    ModifyKey.CTRL,
    'debug.openWindow();');
});
To use:
- Open the application or press F5
- Press Ctrl-F9
There you are. The preferred way to open the Debug window. And no debug code you will have to remember to remove before shipping to the customer!