Check application API performance
Metered API calls come from applications that are not part of the SuperOffice standard products.
Count is the number of API calls. Record count is how many database records these API calls asked for. One database record could be asking for a company (with all additional entities, such as address, phones, URLs, and emails), and it may be one contact person with all additional entities linked to it. Asking for a list will count each list item as one database record.
At a glance
The API Performance tab shows API-level application performance for one specific application.
In the Developer Portal, go to your app page.
To see the list of all apps:
- Select Apps from the top menu to see all apps across every partner you have access to, or
- Go to the Applications section of your partner page to see that partner's apps.
Select API metrics, then select API Performance tab.
Select a time range interval (minutes, hours, or days).
Click through the environment specific buttons.
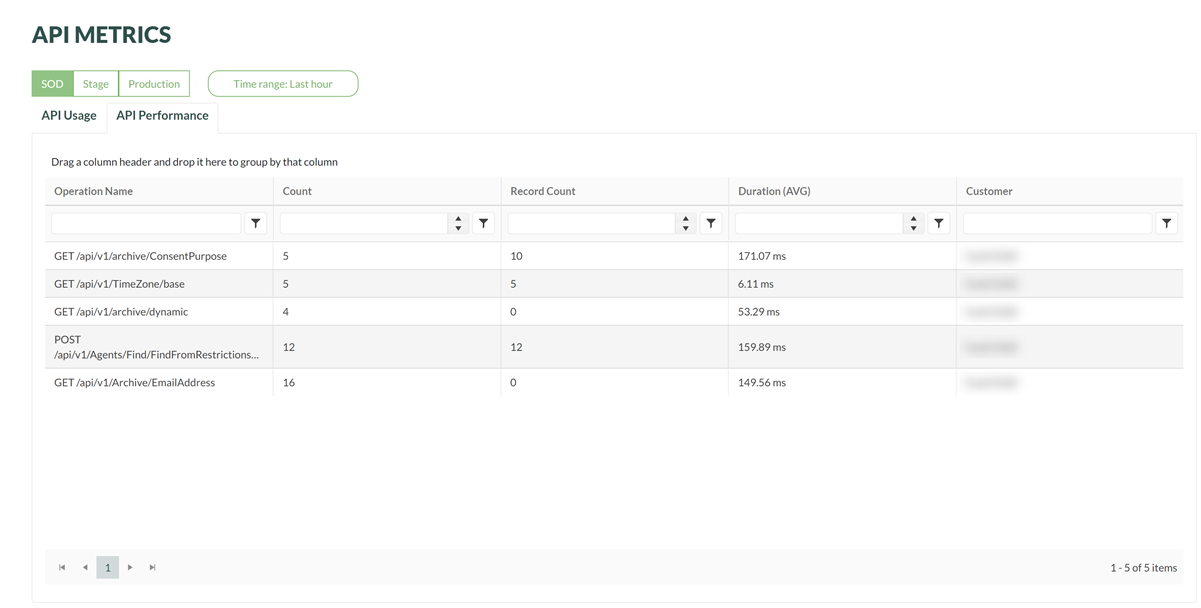
Columns
| Type of usage | Description |
|---|---|
| Operation Name | The API endpoint. |
| Count | The number of API invocations to the endpoint. |
| Record Count | The number of database records selected by the API invocation. |
| Duration (AVG) | The average number number of milliseconds elapsed for each of all API invocations. |
| Customer | The customer context identifier that invoked the API. |
Tip
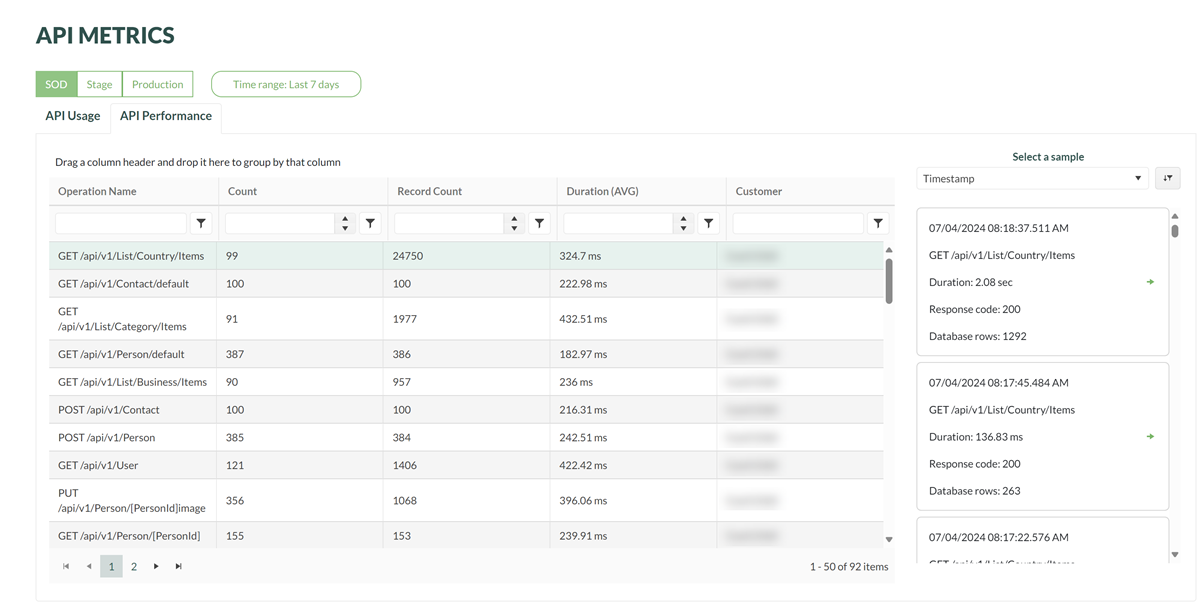
Click on a row to observe the samples (individual invocations) related to the endpoint.
When there are many rows, you can filter the list by typing in the search box. The list will update as you type.
Filter by sample
To see the request details, select one of the samples from the samples list.
Use the sort option drop-down menu above the list to sort the samples according to timestamp, database rows, or duration.
Observe the sample details:
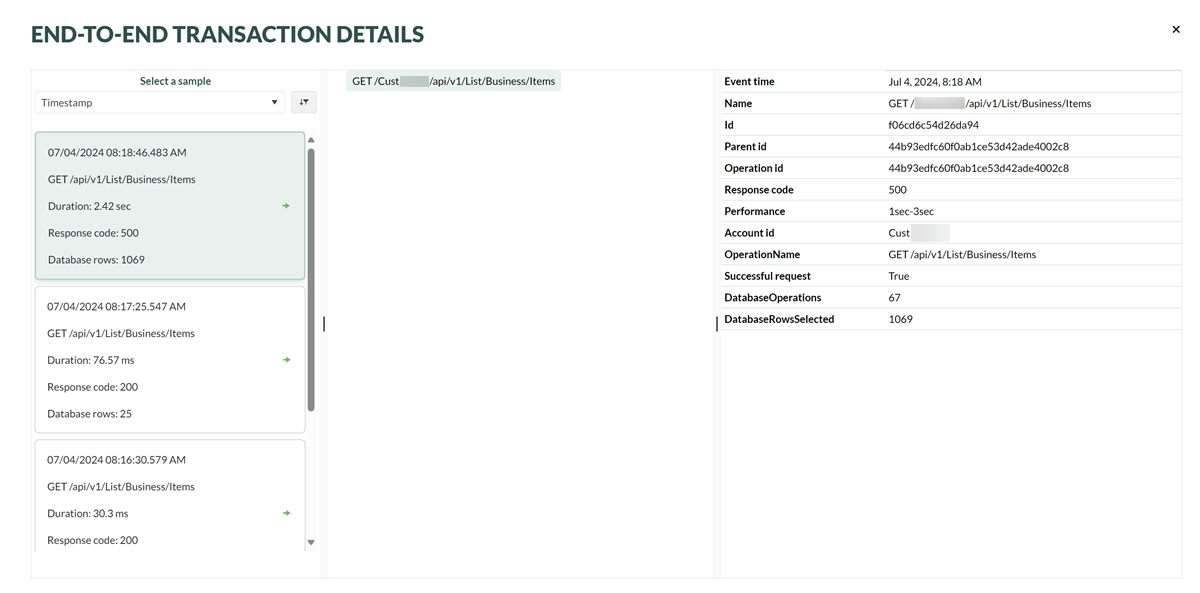
Note
The left side samples column contains each invocation for the endpoint. The center column contains the endpoint and the column on the right contains the invocation details.
To return to the API Performance list, click the X in the upper-right corner.
Disable API request sampling
Starting from SuperOffice version 10.5.1, API request sampling was introduced to reduce the volume of logged data and improve performance monitoring. By default, only a subset of API requests is recorded. However, sampling can be temporarily disabled if you need full visibility into all API traffic. This is especially useful when:
- You're troubleshooting specific performance issues.
- You need to verify the exact timing and frequency of API calls.
- You're analyzing detailed request patterns for optimization.
To disable sampling:
Click the settings icon (cogwheel) to edit setting.
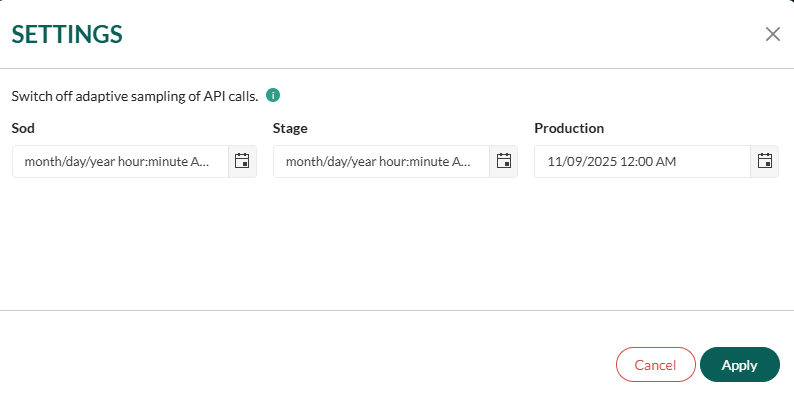
Set the end time for the period during which sampling should be disabled for a specific app.
During this period, every API request will be logged and visible in, you will see itemCount = 1.
Note
Disabling sampling may increase the volume of logged data, so it's recommended to use this feature only when necessary and for limited timeframes.
Improve app performance
Leverage our best practices for online app development to both boost your application's performance and reduce its API usage. Both caching and search have a huge impact.
Additional columns from SuperOffice version 10.5.1
| Column | Description |
|---|---|
| NsApiSlow | True if API call is higher than treshold. You will find tresholds for methods in our documentation. |
| providerName | The archive provider used in the request (e.g., contact, sale, project). Knowing the provider helps identify the data source and optimize queries accordingly. |
| columns | Specifies which columns are requested from the archive provider. Best practice: Limit the number of columns to only those needed to reduce payload size and improve performance. |
| restriction | Filters applied to the search query. Tip: Use indexed fields and avoid complex expressions to enhance query speed. |
| pageSize | Number of items returned per page. Default is 1000. |
| page | The page number of the result set. Useful for paginated queries. |
| sortOrder | Sorting applied to the result set, if any. Note: Sorting on indexed fields is faster. Avoid sorting on calculated or non-indexed fields. |
| itemCount | Number of similar API calls made in the past 24 hours. Can be used to identify high-traffic endpoints and optimize caching or batching strategies. |
| url | The full URL of the API request. Useful for debugging and reproducing queries. |
During development, following the statistics in SOD day-by-day can provide valuable insight into the impact of your improvements.