Using StatLib class in CRMScript for reporting
CRMScript has some classes for creating rather powerful reports. These classes will be used to query data, perform any required transformations, group and calculate aggregate functions, and finally iterate data to print results. Some of the steps in this workflow, and consequently the matching class, are optional, but I will show them all in this text. The classes used are:
| Class | Description |
|---|---|
| SearchEngine | Used to query data from the database. |
| StringMatrix | A straightforward matrix of values (formatted as Strings) which can be iterated to do transformations of data. |
| StatLib | Used to iterate over the data and calculate groups and aggregate functions. |
| StatResult | A utility class making iterating the StatLib instance more pretty. |
So, in this example, let's say we would like to create a report listing number of requests, average closing time for each user in the system for requests created the previous month. Furthermore, we would like this grouped by an extra field we have created on request which tells us if this is a hardware or software issue. Unfortunately, this field only contains various texts, so we need to do some transformations. If the value of this field contains "Cisco" or "Linksys", it is considered hardware, otherwise it is software. This is to exemplify how to transform data before grouping and aggregating.
First, let's create a SearchEngine, which will fetch our data. The DateTime class has some nice functionality to get previous month. You can find details about the ticket fields in the database reference.
DateTime start; // New datetimes are initialized to now
start.moveToMonthStart(); // Rewind to the 1st this month at 00:00:00
DateTime stop = start;
start.addMonth(-1); // Rewind to the 1st of previous month at 00:00:00
// By now, if we're at September 30 2009, start will be "2009-08-01 00:00:00"
// and stop will be "2009-09-01 00:00:00"
SearchEngine theQuery;
theQuery.addField("ticket.owned_by.username");
theQuery.addField("ticket.x_equipment");
theQuery.addField("ticket.time_to_close"); // NOTE: these fields are (unfortunately minutes), not seconds.
theQuery.addCriteria("ticket.created_at", "OperatorGte", start, "OperatorAnd", 0);
theQuery.addCriteria("ticket.created_at", "OperatorLt", stop, "OperatorAnd", 0);
We now have a query that will execute something like this:
select ejuser.username, ticket.time_to_close, ticket.time_to_reply
from ticket
left join ejuser on ticket.owned_by = ejuser.id
where ticket.created_at >= '2009-08-01 00:00:00' and ticket.created_at < '2009-09-01 00:00:00'
This will give us our dataset that we are interested in. We now feed this into the StringMatrix which allows us to transform the second column to "hardware" or "software" so that we can group on it. Note that if you do not need to do any transformations of the data, you could bypass this step by calling StatLib.setSearchEngine() instead. The StringMatrix is simply a matrix of all the data in the query result, and allows you to modify cells, delete or add rows. In our example, we will iterate all rows and check the value of ticket.x_equipment and convert it to "hardware" or "software" depending on what we think it is. Another typical usage of transformations is to change dates to Q1-Q4 for instance, so that you afterwards can group on quarter.
StringMatrix theMatrix;
theQuery.executeInto(theMatrix);
for (Integer row = 0; row < theMatrix.getNumRows(); row++)
    if (theMatrix.getCell(row, 1).findCase("cisco") >= 0 || theMatrix.getCell(row, 1).findCase("linksys") >= 0)
        theMatrix.setCell(row, 1, "Hardware");
    else
        theMatrix.setCell(row, 1, "Software");
We have now fixed our dataset, so that all values in column 1 will be "Hardware" or "Software". We can now send this dataset to our StatLib instance.
StatLib theStatLib;
theStatLib.setStringMatrix(theMatrix); // NOTE: setSearchEngine(theQuery) could have been used if no transformations were needed
Now, on StatLib, we can specify our groups.
Note
Due to a limitation of this object, grouping can only be done on column 0..n in ascending order. You first have to group on column 0, then on column 1, and so on. Make sure your query starts with the columns you would like to group on.
theStatLib.addGroup(0, false, false); // Group on first column of dataset, sort ascending, compare as string (not number)
theStatLib.addGroup(1, false, false); // Group on second column of dataset, sort ascending, compare as string (not number)
Furthermore, we can specify our aggregate functions. Possible types are:
- count
- sum
- avg
- max
- min
- countNotEmpty
theStatLib.addAggregate(0, 0, "numRequestsPrUser", "count", 0) // Add function on group 0, column 0, call it "numRequestsPrUser", type "count", 0 decimals
theStatLib.addAggregate(0, 2, "avgTimeToClosePrUser", "avg", 0); // Add function on group 0, column 2, call it "avgTimeToClosePrUser", type "avg", 0 decimals
theStatLib.addAggregate(1, 0, "numRequestsPrUserAndType", "count", 0); // Add function on group 1, colum 0, call it "numRequestsPrUserAndType", type "count", 0 decimals
theStatLib.addAggregate(1, 2, "avgTimeToClosePrUserAndType", "avg", 0); // Add function on group 1, column 2, call it "avgTimeToClosePrUserAndType", type "avg", 0 decimals
Now, we have set up our StatLib, and we can execute it. To simplify the traversing of it afterwards, we can use the StatResult class:
StatResult theResult;
theStatLib.execute(theResult); // Execute StatLib and store result in StatResult instance.
print(" ");
print("HW/SW# of requestsAverage closing time");
for (theResult.rewind(); !theResult.eof(); theResult.next())
{
    if (theResult.atGroupBegin(0))
        print("" + theResult.getField(0) + "");
    if (theResult.atGroupBegin(1))
        print("" + theResult.getField(1) + "" + theResult.getField("numRequestsPrUserAndType") + "" + theResult.getField("avgTimeToClosePrUserAndType") + "");
    if (theResult.atGroupEnd(0))
        print("Total" + theResult.getField("numRequestsPrUser") + "" + theResult.getField("avgTimeToClosePrUser") + "");
}
print("");
The result of this should now be a table listing something like this:
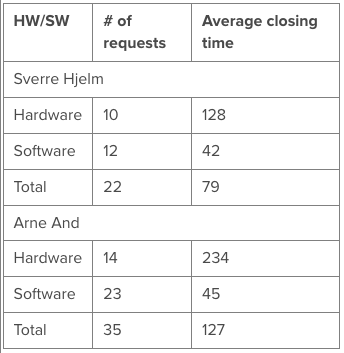
A nice improvement could be to use the TimeSpan class to pretty-print the closing time. Also, one could make this into a single-row report (one row per person). Note that in this case, it would be wise to use some variables (or perhaps a map) which remembers each value, and the print the row on result.atGroupEnd(0). The reason for this is that you cannot be guaranteed that all types will show up. If I do not have any requests of type Hardware, then I will never get a group for this. This is similar to grouping in a database.