Tracing
The tracing feature records every detail in the execution of a script or macro and save it in a log. Every time the script or macro is used, the execution is recorded.
You can then investigate the script execution by rewinding and fast-forwarding through the recording. You get a full list of all the recorded executions of the script, and by whom the script was executed. This allows you to see how your scripts behaved and see all the variables at any given point.
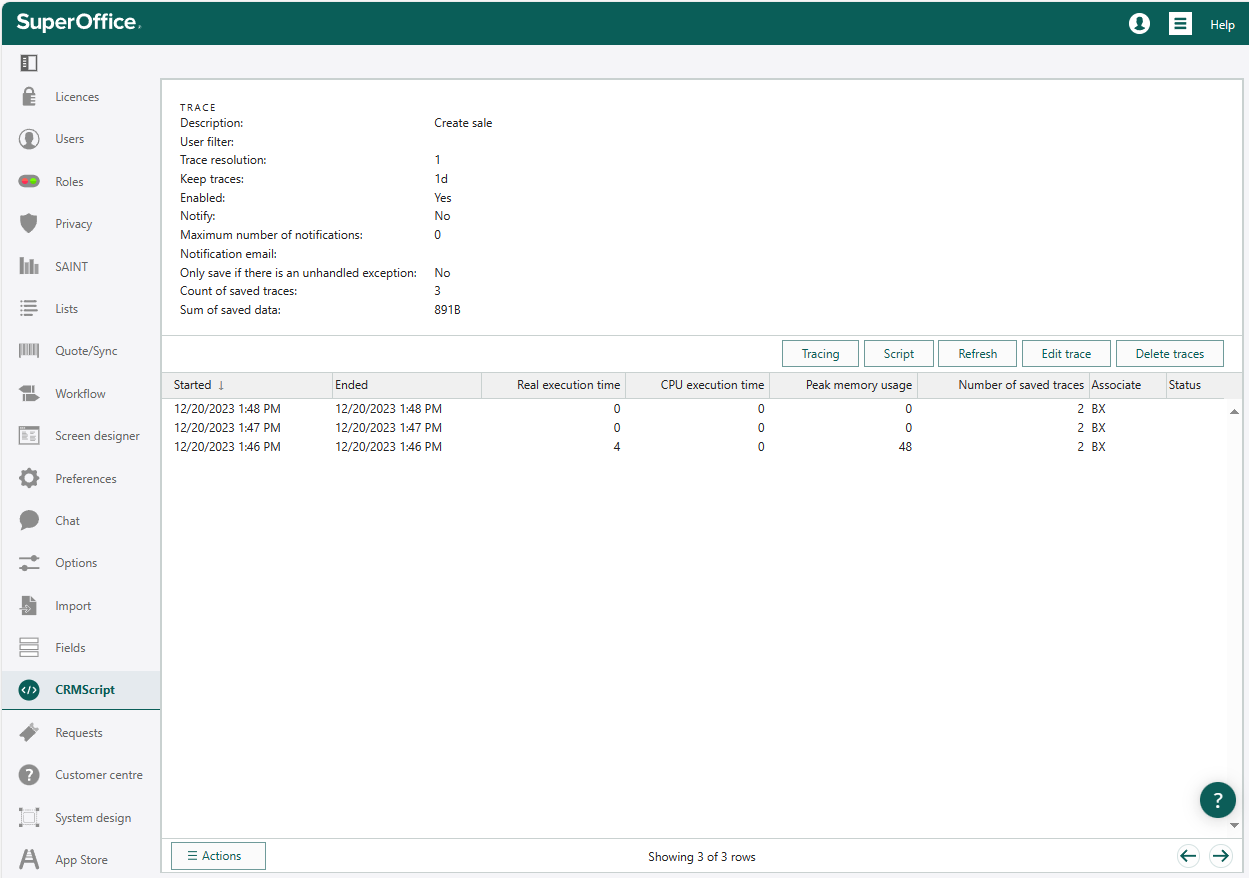
View traces
The Tracing tab contains a list of all traces. Click a trace in the list to view the details.
Start a trace
Do one of the following:
- Open a script or macro in Debugger and click Trace script.
- Open a script or macro in the Macros and scripts tab and click Trace script.
Enter a description of the trace, to make it easier to identify.
Optionally, set User filter if you want a user-specific trace.
Optionally, specify notification and storage properties. See list of fields below.
Select Enabled to activate the trace.
Click OK when you are done.
Turn on/off all enabled traces
- Go to CRMScript > Debug sessions.
- Click Start tracing scripts to start tracing the scripts in the list. Click Stop tracing scripts to pause tracing.
Edit trace
- Click a trace in the Tracing list to open it.
- Click Edit trace.
- Update the fields as needed.
- Click OK when you are done.

Fields
| Field | Description |
|---|---|
| Description | An explanation of the trace, to make it easier to identify. |
| User filter | Limits tracing to a specific user. |
| Trace resolution | The sampling frequency of the trace log. 1 - trace every execution of the script; 5 - trace every fifth execution; and so on. |
| Keep traces | How long to keep a trace before deleting it. |
| Enabled | Activates the trace. |
| Notify | Whether to send notification emails. |
| Max number of notifications | Limits number of emails sent. |
| Notification email | Where to send notifications. |
| Only save if there is an unhandled exception | Limits trace to exceptions. |