Using trace
SuperOffice CRM Online has a built-in tracing feature. When enabled, each run of a script or macro is recorded and stored in a log. You can investigate the behavior of the script step by step by rewinding and fast-forwarding through the recording. You can also inspect the variables at any point in the run.
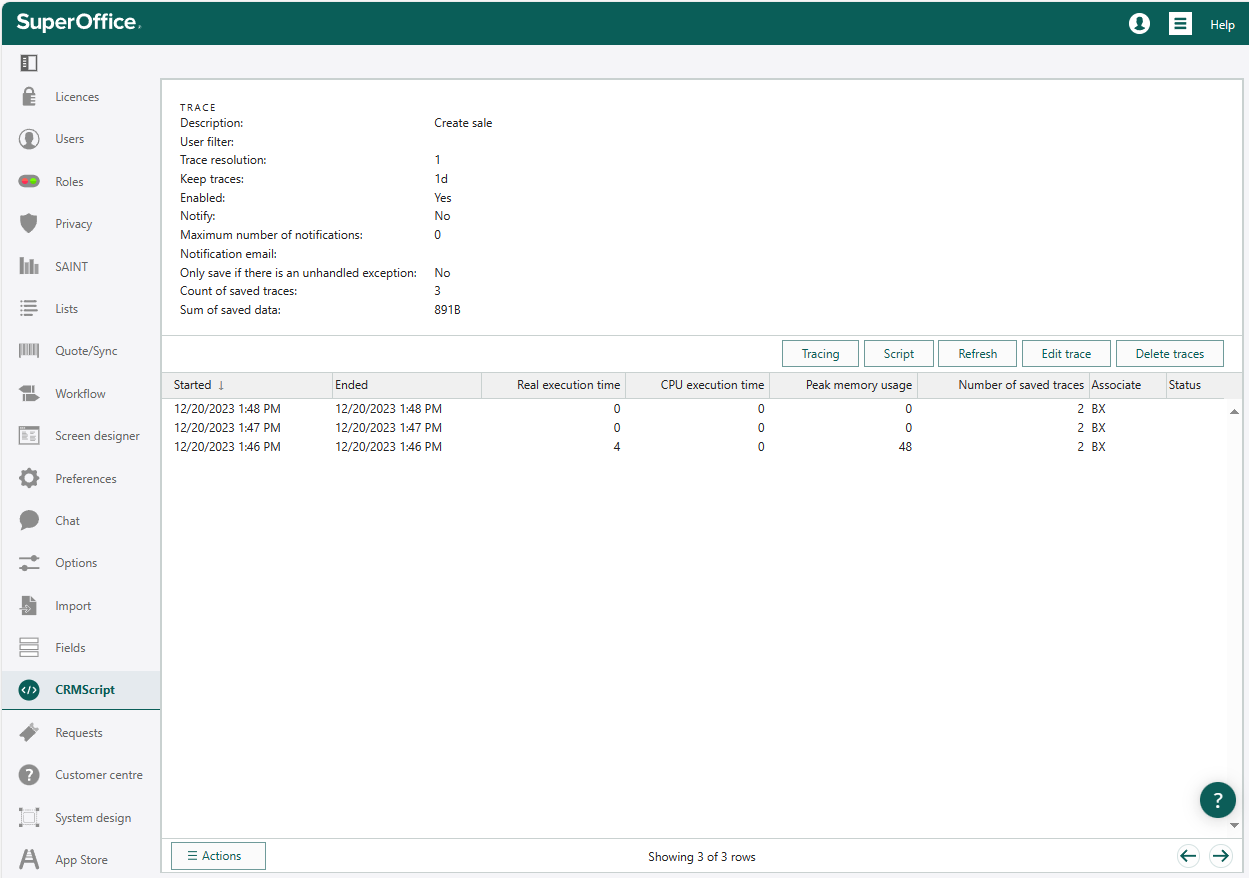
Tracing tab
The Tracing tab lists all traces in the system. Select any trace to view its details.
Start a trace
- Open your script or macro in Settings and maintenance.
- Click Trace script.
- Enter a clear description.
- Optionally, set User filter to trace only runs by a specific user.
- Optionally, enable notifications.
- Optionally, configure sampling frequency, retention settings, and exception-only tracing.
- Select Enabled.
- Click OK.
After enabling a trace, keep the tab open. In a new tab, perform the action that triggers the script. For example, if your script runs before saving a company, go to a company card, click Edit (), and then click Save. Return to the trace tab and refresh.
Inspect a trace
- Click Refresh and select the row from the recent run.
- The left side shows the script, with the current line highlighted.
- The right side shows all variables. Click the ellipse (…) to expand.
- Use the slider or Step buttons to move through the variables and statements.
- Click Return when done.
Call-stack depth
CRMScript keeps track of its current call stack depth, and saves it with the tracing information.
Consecutive code lines are usually at the same depth. Staying at a certain depth means that you don't step into functions being called.
Using the call-stack depth, you can do much more advanced stepping when inspecting a trace:
- Step back: Go to the previous statement at the current depth.
- Step in: Go to the next frame.
- Step out scope: Exit the current scope (for example, a loop) and go to the next statement.
- Step out: Exit the current function and go to the next statement.
- Step next: Go to the next statement at the same depth or higher.
Manage all traces
- Go to CRMScript > Debug sessions.
- Click Start tracing scripts to turn on all enabled traces.
- Click Stop tracing scripts to pause tracing.
Edit a trace
- In the Tracing tab, select a trace.
- Click Edit trace.
- Update the fields as needed.
- Click OK.
Field reference
| Field | Description |
|---|---|
| Description | A label for identifying the trace. |
| User filter | Limits tracing to a specific user. |
| Trace resolution | Sampling frequency. For example, 1 traces every run; 5 traces every fifth run. |
| Keep traces | How long to keep trace data before deletion. |
| Enabled | Activates the trace. |
| Notify | Sends notification emails. |
| Max number of notifications | Maximum number of emails to send. |
| Notification email | Recipient email address. |
| Only save if there is an unhandled exception | Saves trace runs only when an exception occurs, or when forceSaveTrace(true) is called. |
Limits and storage
A trace is disabled when it reaches 100 runs or 100 MB of stored data. Delete older runs or wait for automatic nightly cleanup. Re-enable the trace to continue tracing.
Consider what you need to trace. The Only trace when it is required setting logs only unhandled exceptions or calls to forceSaveTrace(true). Use this together with notifications to monitor scripts efficiently.
Notifications
If notifications are enabled, emails are sent after saving a trace run. To avoid excessive messages, you can limit the number of emails sent. The counter decreases with each email.